

via A Comparison of the Tax Burden on Labor in the OECD | Tax Foundation.
Celebrating humanity's flourishing through the spread of capitalism and the rule of law
17 Jul 2015 Leave a comment
in politics - Australia, politics - New Zealand, politics - USA, public economics, taxation Tags: growth of government, size of government, tax burdens, taxation and the labour supply
10 Jul 2015 Leave a comment
in applied price theory, applied welfare economics, comparative institutional analysis, constitutional political economy, currency unions, fiscal policy, global financial crisis (GFC), income redistribution, liberalism, macroeconomics, Marxist economics, Public Choice, public economics, rentseeking Tags: Eurosclerosis, expressive voting, Greece, rational ignorance, rational irrationality, sovereign default
09 Jul 2015 1 Comment
in economics of bureaucracy, politics - New Zealand, Public Choice, public economics, rentseeking, transport economics Tags: corporate welfare, hard budget constraints, KiwiRail, privatisation, public ownership, state owned enterprises, state-owned enterprise welfare
In the finest public service traditions of free and frank advice, the New Zealand Treasury in its budget advice this year advised ministers to contemplate shutting down KiwiRail.
Treasury recommended the Government fund KiwiRail for one more year and undertake a comprehensive public study to look into closing the company. The study is public so that people were informed of the costs of running the rail network compared with any benefits it provided. The Government rejected the idea.
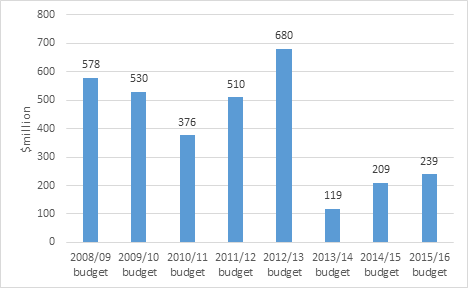
Figure 1: State-owned enterprise welfare, Vote Transport and Vote Finance (KiwiRail), Budgets 08/09 to 15/16
Source: New Zealand budget papers, various years.
KiwiRail has been a constant thorn in the taxpayers’ side. Since this rail business was acquired in 2008 for $665 million as a commercial investment, Crown investments have totalled $3.4 billion – see Figure 1.
Fortunately in the 2015 budget, the Minister of Finance signalled that the government’s patience with the KiwiRail deficits is not unlimited. KiwiRail has a 10-year Turnaround Plan to make its freight business commercially viable. The current network of 4,000 km must be reduced to 2,300 km for the company to even breakeven. The Treasury advised, to no avail, that this massive and painful restructuring was required before KiwiRail was purchased. The purchase went through.
The latest developments where Treasury advised ministers to contemplate shutting the network down is an opportunity for ministers, and the opposition spokesmen on finance and transport both to say how much is too much in accumulated KiwiRail losses.
The Minister of Finance and his Cabinet colleagues must say after the public review that there is only so much more left in the cupboard to bailout KiwiRail losses. After that fiscal cap is reached, KiwiRail is on its own. If that means bankruptcy and network closure, so be it.
In the interim, on the side of every KiwiRail train there should be advertising billboards with the following disclosure statements:
09 Jul 2015 Leave a comment
in economic history, politics - USA, public economics Tags: growth of government, size of government
07 Jul 2015 Leave a comment
in applied price theory, applied welfare economics, development economics, economic growth, economic history, energy economics, environmental economics, growth disasters, growth miracles, health and safety, industrial organisation, international economics, labour economics, law and economics, liberalism, property rights, public economics Tags: healthier is wealthier, Japan, Kuznets environmental curve, richer is greener, richer is safer
The Kuznets environmental curve describes an empirical regularity between environmental quality and economic growth. Outdoor water, air and other pollution first worse and then improves as a country first experiences economic growth and development.

While many pollutants exhibit this pattern in the Kuznets environmental curve, peak pollution levels occur at different income levels for different pollutants, countries and time periods. John Tierney explains:
In dozens of studies, researchers identified Kuznets curves for a variety of environmental problems.
There are exceptions to the trend, especially in countries with inept governments and poor systems of property rights, but in general, richer is eventually greener.
As incomes go up, people often focus first on cleaning up their drinking water, and then later on air pollutants like sulphur dioxide.
As their wealth grows, people consume more energy, but they move to more efficient and cleaner sources — from wood to coal and oil, and then to natural gas and nuclear power, progressively emitting less carbon per unit of energy.
When I was living in Japan in the mid 1990s, they just completed a period of rapid operation of the Kuznets environmental curve. I was told by my professors at Graduate School that in the 1960s, cities and prefectures welcomed polluting industries because of the better paid jobs they offered. At that time, shipping companies used like to go to Tokyo because the pollution in Tokyo Bay was so bad that it would clean all the barnacles off their ships. That made them sail faster.

Japanese incomes and wages doubled over the course of the 1960s. The Japanese voter was now prepared to support stricter pollution standards and environmental controls.
Life expectancy is at an all time high: buff.ly/1ICraAi http://t.co/jgRqKy8LfQ—
HumanProgress.org (@humanprogress) June 28, 2015
In the early 1970s, the ruling LDP stole the long-standing environmental policies of their opponents in a big crack down on pollution because the country could now afforded them.
Poverty has plummeted in East Asia and the world. buff.ly/1NtIDyY http://t.co/SsY3sf3kyH—
HumanProgress.org (@humanprogress) July 01, 2015
Plenty of developing countries are democracies now. Their people could demand through the ballot box higher environmental standards and clean tap water but they don’t because of its cost to economic development.
These 4 nations are 50% of mankind. That's 3.5 billion people who are living longer. buff.ly/1Kle6mU #health http://t.co/949oqisMsL—
HumanProgress.org (@humanprogress) June 30, 2015
The environmental movement lives in a state of denial regarding the relationship between economic growth and environmental quality.
OECD Better Life Index correlates with GDP
But US lower than poorer countries
& NZL higher than richer countries http://t.co/yrTCnO1B0l—
Max Roser (@MaxCRoser) June 26, 2015
07 Jul 2015 Leave a comment
in applied price theory, applied welfare economics, comparative institutional analysis, economics of bureaucracy, entrepreneurship, income redistribution, industrial organisation, managerial economics, organisational economics, politics - New Zealand, Public Choice, public economics, rentseeking, survivor principle Tags: corporate welfare, entrepreneurial alertness, industry policy, industry targeting, The fatal conceit, The pretence to knowledge
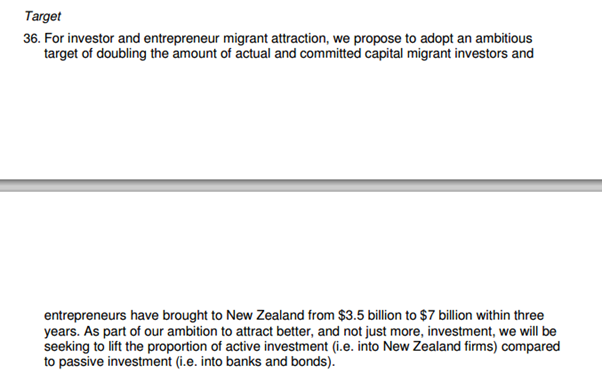

I didn’t notice any discussion in the Cabinet paper of a government doing this before and whether their investment promotion efforts succeeded or not. This latest policy proposal cannot even count as evidence-based policy dreaming, much less a serious contribution to public policy.

Hoping to double incoming foreign investor and entrepreneur migration from $3.5 billion to $7 billion inside three years without spending any extra public money is breathless public policy making. I am sure lots of governments previously tried to get something for nothing.

It will be helpful if ministers pointed to where overseas governments have been successful in doubling foreign investment by simply reprioritising existing investment promotion efforts.

There are at least 2,500 national, provincial and city investment promotion agencies out. Some of them must have been subject to some sort of evaluation as to their success.

This overseas literature review would be in addition to the recent findings of the Ministry of Economic Development about the poor performance and perhaps futility of the foreign direct investment promotion by New Zealand Trade and Enterprise.
Imagine how much bigger a boost in foreign investor and entrepreneur migration lays before us if actual real new money was put on the table.
via beehive.govt.nz – Strategy targets international investors and Evaluation of NZTE investment support activities [929 KB PDF]
.
03 Jul 2015 Leave a comment
in constitutional political economy, income redistribution, Public Choice, public economics, rentseeking Tags: British economy, British politics, Director's Law, expressive voting, growth of government, median voter theorem, size of government
No, most U.K. homes do not get more in benefits than they pay in tax ow.ly/3y0nEo http://t.co/LaXvGa8ro2—
Bloomberg VisualData (@BBGVisualData) July 02, 2015
…the poorest 30 percent of households receive significantly more in cash benefits than they pay in tax. The next 10 percent receive on average £596 pounds a year more in cash benefits than they pay in tax, and the top 60 percent all pay more in tax than they get back in cash benefits.
New data from the ONS show the huge growth in state dependency under New Labour. Analysis at cps.org.uk/files/factshee… http://t.co/OLjRoxt3eg—
CPS Think Tank (@CPSThinkTank) June 29, 2015
30 Jun 2015 Leave a comment
Who pays income tax in New Zealand, and how much http://t.co/NpRvzYWbc2—
New Zealand Treasury (@nztreasury) April 12, 2015
30 Jun 2015 Leave a comment
in labour economics, minimum wage, poverty and inequality, public economics Tags: earned income tax credit, family tax benefits, working for families
What are alternatives to the minimum wage, and how do they effect workers and taxpayers? buff.ly/1c4BYhd http://t.co/hf67ujjvOK—
MRUniversity (@MRevUniversity) May 20, 2015
29 Jun 2015 Leave a comment
in economic history, entrepreneurship, income redistribution, politics - USA, Public Choice, public economics, rentseeking Tags: Eurosclerosis, taxation and entrepreneurship, taxation and investment, taxation and the labour supply, top 1%
Piketty presents the changes in the top marginal income tax rate throughout the 20th century… #GCLIS http://t.co/sFpV0ypC5C—
LIS (@lisdata) April 16, 2014
29 Jun 2015 Leave a comment
Where New Zealand's core Crown expenses go http://t.co/SjgLVoDDfQ—
New Zealand Treasury (@nztreasury) January 27, 2015
27 Jun 2015 Leave a comment
in labour supply, politics - Australia, politics - New Zealand, politics - USA, poverty and inequality, public economics Tags: Australia, British economy, family tax credits, family taxation, in-work tax credits, social insurance, taxation and the labour supply, welfare state
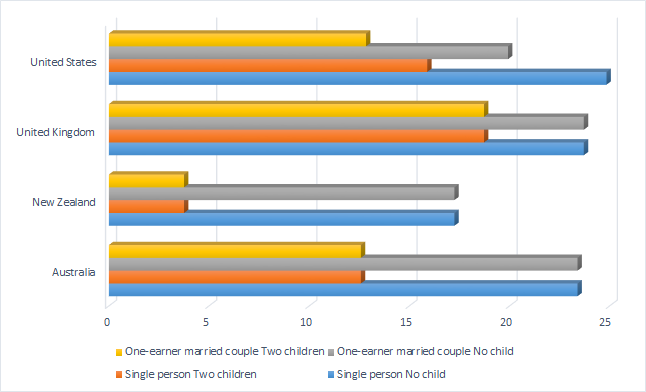
Figure 1: All in less cash transfers average income tax rates at average wage, 2014
Source: OECD tax database
24 Jun 2015 Leave a comment
in comparative institutional analysis, financial economics, income redistribution, politics - New Zealand, Public Choice, public economics Tags: ageing society, demographic crisis, New Zealand superannuation fund, old age pensions, social insurance, sovereign wealth funds, welfare state

The $30 billion New Zealand Superannuation Fund is the best performing sovereign wealth fund over the past five years, generating returns of more than 17 per cent a year.
Those returns easily beat all other sovereign wealth funds that publish their figures, according to a global study by JP Morgan. In the last three years alone, the fund returned an average of 21 per cent a year.
Good thing to do considering that the default deadweight cost of taxation is put by that Treasury to be 20%:
As a general rule, deadweight losses should be included if they are of sufficient size relative to the overall costs and benefits of the proposal that they are capable of altering the decision as to whether or not to proceed with the proposal.
Having said this, deadweight losses are notoriously difficult to quantify. Estimates vary from 14% up to 50% of the revenue collected.
Treasury suggests a rate of 20% as a default deadweight loss value in the absence of an alternative evidence based value. Thus public expenditures should be multiplied by a factor of 1.2 prior to discounting to incorporate the effects of deadweight loss.
This deadweight cost of taxation includes funds contributed to New Zealand government owned investment funds. In a speech last week, the Super Fund chairman Gavin Walker warned that the recent high returns were unlikely to continue in the long-term:
The last few years are likely to have been among the best years the fund will experience for some time,” he said. “On average and over the long-term we expect to earn the rather less exciting figure of 8 per cent [per annum] – but which will still provide a handsome return to New Zealander stakeholders.
The New Zealand Superannuation Fund must beat the market every single year to make up for the deadweight cost of its funding, the usual interest rate on borrowed funds, a premium for the investment risk added to the Crown’s portfolio and the cost to New Zealand’s growth rate of higher than otherwise taxes on income, entrepreneurship and investment.
Most mutual funds still can't beat their benchmark read.bi/1GkTig1 http://t.co/r7ezoDGJbV—
BI Chart of the Day (@chartoftheday) June 03, 2015
23 Jun 2015 Leave a comment
in fiscal policy, macroeconomics, politics - Australia, politics - New Zealand, politics - USA, population economics, public economics Tags: Australia, British economy, New Zealand, taxation and the labour supply
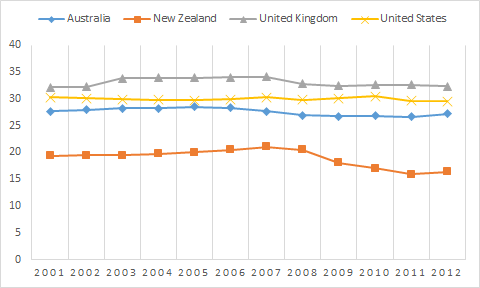
Figure 1: Direct taxes on the average worker in Australia, New Zealand, USA and UK, 2001 – 2012
Source: OECD Factbook 2014
Taxes on the average worker measure the ratio between the amount of taxes paid by the worker and the employer on the country average wage and the corresponding total labour cost for the employer. This tax wedge measures the extent to which the tax system on labour income discourages employment.
The taxes included in the measure are personal income taxes, employees’ social security contributions and employers’ social security contributions. For the few countries that have them, it also includes payroll taxes. The amount of these taxes paid in relation to the employment of one average worker is expressed as a percentage of their labour cost (gross wage plus employers’ social security contributions and payroll tax).
An average worker is defined as somebody who earns the average income of full-time workers of the country concerned in Sectors B-N of the International Standard Industrial Classification (ISIC Rev. 4). The average worker is considered single without children, meaning that he or she does not receive any tax relief in respect of a spouse, unmarried partner or child.
Celebrating humanity's flourishing through the spread of capitalism and the rule of law
Celebrating humanity's flourishing through the spread of capitalism and the rule of law
Celebrating humanity's flourishing through the spread of capitalism and the rule of law
Celebrating humanity's flourishing through the spread of capitalism and the rule of law
Celebrating humanity's flourishing through the spread of capitalism and the rule of law
Celebrating humanity's flourishing through the spread of capitalism and the rule of law
Celebrating humanity's flourishing through the spread of capitalism and the rule of law
Celebrating humanity's flourishing through the spread of capitalism and the rule of law
A History of the Alt-Right
Econ Prof at George Mason University, Economic Historian, Québécois
Celebrating humanity's flourishing through the spread of capitalism and the rule of law
Scholarly commentary on law, economics, and more
Beatrice Cherrier's blog
Celebrating humanity's flourishing through the spread of capitalism and the rule of law
Celebrating humanity's flourishing through the spread of capitalism and the rule of law
Celebrating humanity's flourishing through the spread of capitalism and the rule of law
Why Evolution is True is a blog written by Jerry Coyne, centered on evolution and biology but also dealing with diverse topics like politics, culture, and cats.
Celebrating humanity's flourishing through the spread of capitalism and the rule of law
A rural perspective with a blue tint by Ele Ludemann
DPF's Kiwiblog - Fomenting Happy Mischief since 2003
Celebrating humanity's flourishing through the spread of capitalism and the rule of law
The world's most viewed site on global warming and climate change
Tim Harding's writings on rationality, informal logic and skepticism
A window into Doc Freiberger's library
Let's examine hard decisions!
Commentary on monetary policy in the spirit of R. G. Hawtrey
Thoughts on public policy and the media
Celebrating humanity's flourishing through the spread of capitalism and the rule of law
Politics and the economy
A blog (primarily) on Canadian and Commonwealth political history and institutions
Reading between the lines, and underneath the hype.
Economics, and such stuff as dreams are made on
"The British constitution has always been puzzling, and always will be." --Queen Elizabeth II
Celebrating humanity's flourishing through the spread of capitalism and the rule of law
Celebrating humanity's flourishing through the spread of capitalism and the rule of law
WORLD WAR II, MUSIC, HISTORY, HOLOCAUST
Undisciplined scholar, recovering academic
Celebrating humanity's flourishing through the spread of capitalism and the rule of law
Res ipsa loquitur - The thing itself speaks
In Hume’s spirit, I will attempt to serve as an ambassador from my world of economics, and help in “finding topics of conversation fit for the entertainment of rational creatures.”
Researching the House of Commons, 1832-1868
Articles and research from the History of Parliament Trust
Reflections on books and art
Posts on the History of Law, Crime, and Justice
Celebrating humanity's flourishing through the spread of capitalism and the rule of law
Exploring the Monarchs of Europe


Recent Comments