With multiple generations of family? A look at party ID by year-of-birth dating to 1929 https://t.co/XkVoITAONJ pic.twitter.com/pA6mCes6al
— Alec Tyson (@alec_h_tyson) November 27, 2015
Partisan advantage by date of birth
29 Nov 2015 Leave a comment
in politics - USA Tags: voter demographics
Fact checking @Bernie Sanders latest presidential debate
27 Nov 2015 Leave a comment
in applied price theory, applied welfare economics, economic growth, labour economics, politics - USA, poverty and inequality, welfare reform Tags: 2016 presidential election, Leftover Left, Twitter left
An example of American gerrymanders
25 Nov 2015 1 Comment
in politics - USA, Public Choice Tags: gerrymanders
Has @Noahpinion pivoted on minimum wage rises and unemployment?
25 Nov 2015 1 Comment
in applied price theory, labour economics, minimum wage, politics - USA
The incentive effects of the living wage and a carbon tax @BernieSanders
25 Nov 2015 Leave a comment
in applied price theory, energy economics, labour economics, minimum wage, politics - USA Tags: 2016 presidential election, carbon tax, climate alarmism, expressive voting, Leftover Left, living wage, rational irrationality, Twitter left
@Noahpinion can the @LivingWageNZ model close the 30% wage gap with Australia? @arindube
24 Nov 2015 2 Comments
in applied price theory, labour economics, minimum wage, politics - New Zealand, politics - USA
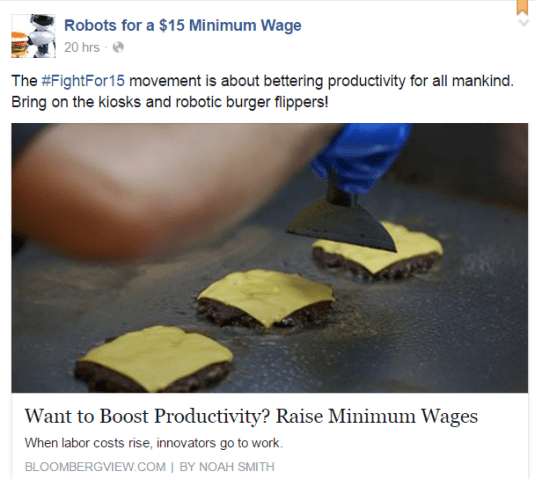
Noah Smith overnight argued that increasing the minimum wage to $15 an hour in the USA will induce innovation that will, in time, mitigate much of the costs of the minimum wage increase to employers:
So minimum-wage laws, by forcing us to abandon low-skilled labour, might actually increase technological innovation. Some people even speculate that this effect might have started the Industrial Revolution itself! Economic historian Robert Allen has argued that the Industrial Revolution began in Europe, rather than in China, because European employers were forced to pay more for labour. Since labour was more expensive, companies invested in technology, which then raised productivity so much that it boosted wages even higher, forcing companies to invest more in technology, even as their increased incomes allowed them to make those investments. A 1987 theory by growth economics pioneer Paul Romer operated on a similar principle — expensive labour causes an upward spiral of technological improvement.
Smith is confusing induced innovation with standard substitution effects and offsetting behaviour. When you make something more expensive, buyers look for cheaper alternatives including technologies that were previously unprofitable to employ.
Up until the minimum wage increase, these labour saving technologies were not profitable investments because the best available choice was still lawful to employ, which was low skilled labour. A minimum wage increase makes it unlawful to employ the best available alternative. As Modeled Behaviour explains better than me:
If throwing the costly challenges of artificially expensive Labor at businesses drives economic growth, then perhaps we should have an Office of Government Hurdles that is designed to generate arbitrary restrictions for businesses. After all, if this innovation is a driver of economic growth it should have value by itself and not simply as a by-product of some other regulatory goal, e.g. keeping out immigrants or raising wages. Consider a law that banned bending over in the workplace. Is there any doubt that this would spur innovative products that aided in grabbing without bending? Or consider a law that mandated everyone work from home. This would spur massive investment in broadband and telecommunications. But there is no doubt we would be poorer from both of these regulations.
One of the reasons demand curves slope downwards is as the price of the good increases, buyers have other options so they stop buying and pursue these other options which include innovation.
It's pretty simple: Minimum Wage = Compulsory Unemployment http://t.co/6xiX6YCp9Z—
Mark J. Perry (@Mark_J_Perry) July 25, 2015
Smith also falls for the standard labour market policy response in a crisis, which is to send them on a course:
And as workers raise their own skill levels, that new technology would raise their wages as well. The entire economy, including any workers who temporarily lost their low-wage jobs, would benefit in the long run. Of course, this theory is fairly speculative — theories that play out over years or decades are hard to test with real-world data. But it’s a potential benefit of the minimum wage that is worth thinking about.
Whenever there is a crisis in the labour market, the standard policy response is send them on a course. That makes you look like you care and by the time they graduate, the problem might have fixed itself. I encountered this policy response to labour market crises to repeat itself over and over again while working in the bureaucracy.

Clever geeks such as yourself sitting at your desk as a policy analysis, public intellectual, politician, activist or minister did well at university. University graduates succumb to the fatal conceit when they assume others will as well, including those who have neither the ability or aptitude to succeed in education.
Educational romanticism will not solve the disemployment problems of a minimum wage increase. People don’t go on from high school to higher education for a range of reasons that include a lack of motivation to study or a simple lack of ability no matter how hard they try.

Charles Murray believes many students make poor investments by going to college, in part, because many don’t complete their degrees:
…even though college has been dumbed down, it is still too intellectually demanding for a large majority of students, in an age when about 50 per cent of all high school graduates are heading to four-year colleges the next fall. The result is lots of failure. Of those who entered a four-year college in 1995, only 58 per cent had gotten their BA five academic years later
Murray does not want to abandon these teenagers:
…Too few counsellors tell work-bound high-school students how much money crane operators or master stonemasons make (a lot). Too few tell them about the well-paying technical specialties that are being produced by a changing job market. Too few assess the non-academic abilities of work-bound students and direct them toward occupations in which they can reasonably expect to succeed. Worst of all: As these students approach the age at which they can legally drop out of school, they are urged to take more courses in mathematics, literature, history and science so that they can pursue the college fantasy. Is it any wonder that so many of them drop out?
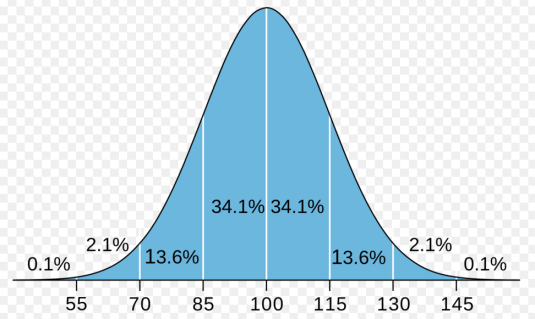
Charles Murray is frank about educational romanticism. Half the population is of below average IQ. That is before considering the necessary personality traits to be a successful student. Asking people without the necessary IQ and personality traits to waste their time with up skilling insults them.
Carrying that send them on a course educational romanticism over to the minimum wage and living wage debates is to use the low skilled as lab rats in the social experiments that are bound to fail as they failed in the past.
One of the purposes of applied price theory, the study of economic history and even labour econometrics is to spare us policy experiments we already know will not turn out well.
We do know what will happen if the minimum wage is raised to $15 per hour. Some people will lose their jobs. More importantly, there is a reduced incentive for the low paid to invest in skills to improve their earning power because the minimum wage is already delivered that assuming they still have a job. Human capital effects of minimum wage increases is under discussed.
As for investing in up skilling, active labour market programs that invest heavily in upskilling the unemployed have a dreadful record. This dreadful record is when there are subsidies direct to the unemployed going on prearranged courses focused on work skills. We’re not talking about indirect incentives such as raising the minimum wage and hoping for the best regarding their upskilling both on the job or while on the unemployment benefit.
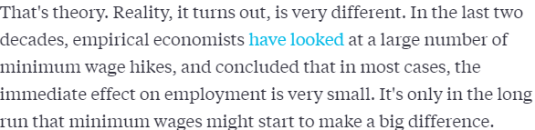
Back to Noah Smith. He admits that increases in the minimum wage reduce employment. He tries to ride out on the conclusion that that increase in unemployment after a small minimum wage increase isn’t much.
Great quote on the cruelty of the minimum wage from Nobel economist Vernon Smith, illustrated by Henry Payne https://t.co/Lwch51acEY—
Mark J. Perry (@Mark_J_Perry) October 24, 2015
Obviously the teenagers and adults thrown onto the scrapheap of society by the increased minimum wage don’t count in the brutal utilitarian calculus employed by Noah Smith and other champions of the low paid.
Smith is now trying to fortify his argument by arguing that minimum wage activists have spotted an untapped innovation right under the noses of entrepreneurs who profit from exploiting gaps in the market faster than the rest. Bureaucrats and politicians notice these gaps in the market before those who gain from superior entrepreneur alertness to hitherto untapped opportunities for profit do so and instead leave that money on the table.
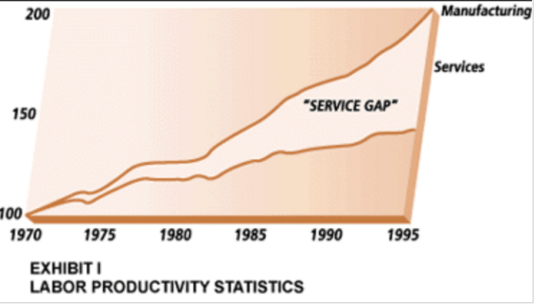
What is even richer in this induced innovation hypothesis of Noah Smith and others is many of these minimum wage workers are in the services sector. Services suffer from Baumol’s disease: the limited ability to innovate in labour-intensive areas.
The optimal timing of innovation spawned a vast literature. So has offsetting behaviour to regulation. The former innovation is welfare enhancing. The latter is mitigation of the dead weight social losses of regulation.
What and where to innovate is a process of market discovery. The life cycle of many industries starts with a burst of new entrants with similar products and production processes. These new or upgraded products and the different ways of making them often use ideas that cross-fertilise.
In time, there is an industry shakeout where a few leapfrog the rest with cost savings and design breakthroughs to yield the mature product (Boldrin and Levine 2008, 2013). Fast-seconds and practical minded latecomers often imitate and successfully commercialise ideas seeded by the market pioneers using prior ideas as their base.
This entire dynamic market process of competitive selection, competition as a discovery procedure, trial and error and leapfrogging is distorted if one or more of the contending entrepreneurs as their hand forced by regulation on labour imports rather than because of competitive merits. The government cannot enable this process because neither the outcome nor even the direction of the competitive struggle for survival is known in advance. To quote Thomas Babington (1830):
The maxim, that governments ought to train the people in the way in which they should go, sounds well. But is there any reason for believing that a government is more likely to lead the people in the right way than the people to fall into the right way of themselves?
The firms that survive and grow in competition with rival ways of doing business are the more efficient simply because they survived. What will survive in market competition will not be known in advance to politicians and activists when they decide to make one specific input more expensive. The results of the competitive market process that weeds out the less efficient firm are known at the end of this long race, not at the start.
Knowing that innovation is induced by changing relative prices and wages doesn’t help wise bureaucrats and farsighted politician know which one of those relative prices or wages will be decisive in determining the direction of innovation. As Alfred Marshall explains in The Social Possibilities of Economic Chivalry (1907):
A Government could print a good edition of Shakespeare’s works, but it could not get them written… I am only urging that every new extension of Governmental work in branches of production which need ceaseless creation and initiative is to be regarded as prima facie anti-social, because it retards the growth of that knowledge and those ideas which are incomparably the most important form of collective wealth.
What is not explored adequately in this debate by either Noah Smith or the New Zealand Living Wage Movement is why limit the efficiency wage and induced innovation hypotheses to low skilled workers.
Why not increase the wages of all workers by 20-30%? There will not be a large disemployment effect and the induced innovation will mitigate the costs, if Noah Smith and his efficiency wage and induced innovation hypotheses are to be believed.
30% would be a good number for increasing all New Zealand wages was that is about the wage gap with Australia. Let’s go for broke. What’s the risk other than massive unemployment and economic chaos?
Does a higher minimum wage really reduce employment? econ.st/1gp4Jbs http://t.co/WGMZGLKHmI—
The Economist (@EconBizFin) July 30, 2015
The living wage sought in New Zealand and the fight for $15 campaign in the USA presuppose massive offsetting labour productivity gains. A doubling in labour productivity overnight in low-paid service and other jobs or at least within a few years because of higher work morale.
The labour productivity increase required to offset even some of the costs of the double-digit living wage increases proposed at home and abroad are large, very large:
Looking first at the 2016 position, the proposed wage floor increase would require productivity growth of around 11% between 2015 and 2016. By 2020, the cumulative productivity gains from 2015 would need to rise above 37%, implying an average annual increase of 6.6%… the pace of productivity growth implied by our thought exercise is unprecedented: the annual average increase during the economic growth years of 1991-2008 was 2.2%. That points to two conclusions. First, firms are likely to need support in meeting the productivity challenge. And second, any productivity plan should look beyond the obvious forms of high-tech wizardry in high value-added sectors to encompass new forms of organisational approaches and business models in our most labour-absorbing industries.
What is missing in most discussions of the efficiency wage hypothesis and the latest discussion of induced innovation and wage increases is, as the Washington Centre for Equitable Growth notes is the upper limit on the wage increase that carries only minimal disemployment risks:
Many activists and policymakers across the country are vigorously pushing for an increase in the minimum wage at the federal, state, and local levels. Of course, while many people agree that the minimum wage needs to be higher, that still leaves the question of how high it should be… The trouble, however, is taking that research and applying it to potential minimum wage increases that would be outside the range of previous hikes. For example, raising the current federal minimum wage from $7.25 to $15—more than doubling it—would be significantly larger than prior increases.
That upper bound discussion is a small hole in their arguments compared to their failure to advocate massive efficiency wage increases and massive induced innovation wage increases across the entire economy. Why is the efficiency wage and induced innovation hypotheses only extended to the low paid? Why not hire wages for everyone?

One of the reasons for the high labour productivity in Western Europe is their minimum wages, employment protection laws and high taxes made it unprofitable to employee low skilled service workers.
European consumers innovated in the face of these high costs of taxes and regulation by doing for themselves what Americans buy on the market be it anything from takeaways to home help. That is well known as Richard Rogerson explains:
The empirical work establishes two results. First, hours worked in Europe decline by almost 45 percent compared to the United States over this period [from 1956 to 2003]. Second, this decline is almost entirely accounted for by the fact that Europe develops a much smaller market service sector than the United States… relative increases in taxes and technological catch-up can account for most of the differences between the European and American time allocations over this period.
The phenomena that developed in Europe as the result of the additional costs of taxes and labour market regulation is known as Eurosclerosis, not a productivity breakout through efficiency wages and induced innovation.
Eurosclerosis, Swedosclerosis, the British Disease and rising inequality harming economic growth
21 Nov 2015 2 Comments
in currency unions, economic growth, economic history, Euro crisis, fiscal policy, macroeconomics, politics - USA Tags: British disease, British economy, Eurosclerosis, France, sick man of Europe, Sweden, Swedosclerosis, Twitter left
The Washington Centre for Equitable Growth have joined the Wall Street Journal in falling for that dodgy OECD hypothesis about rising inequality holding back economic growth.
The chart below shows stark differences between egalitarian Sweden and France, and the more unequal UK since 1970 in departures from a trend growth rate of 1.9% in real GDP per working age person, PPP.

Source: Computed from OECD Stat Extract and The Conference Board. 2015. The Conference Board Total Economy Database™, May 2015, http://www.conference-board.org/data/economydatabase/
In the above chart, a flat line is growth at the same rate as the USA for the 20th century, which was 1.9% for GDP per working age person on a purchasing power parity basis. The USA’s growth rate is taken as the trend rate of growth of the global technological frontier. A falling line in the above chart is growth in real GDP per working age person, PPP, at below this trend rate of 1.9%; a rising line is above trend rate growth for that year.
- Sweden really had been the sick man of Europe until it turned its back on high taxing, welfare state socialism in the early 1990s.
- France has been in a long decline so much so that the global financial crisis is hard to pick up in the acceleration in its long decline in the mid-1990s.
Britain did very well, both under the neoliberal horrors of Thatcherism and the betrayals by Tony Blair of a true Labour Party platform. The UK grew at above the trend annual growth to 1.9% for most of the period from the early 1980s to 2007.
Neither France or Sweden, despite their egalitarian economies, kept up with the US growth rate since 1970. Under the OECD’s hypothesis, if France and Sweden had been more unequal, their trend growth rates would have been even more appalling since 1970.
27 unarmed whites killed by police since 1 January 2015 by threat level
21 Nov 2015 Leave a comment
in economics of crime, law and economics, politics - USA
I did some recoding again because the Washington Post categorises people as not attacking when they are reaching inside their jacket or a car when challenged not to do so or charging armed police. The Washington Post counted 13 whites as no attack in progress. I count six. The three killed in crossfire were a six-year-old, a woman shot when police were aiming at her dog, and a passenger in a fleeing car.

The Gettysburg address was this day in history
20 Nov 2015 Leave a comment
in politics - USA Tags: American Civil War, Gettysburg address, President Lincoln
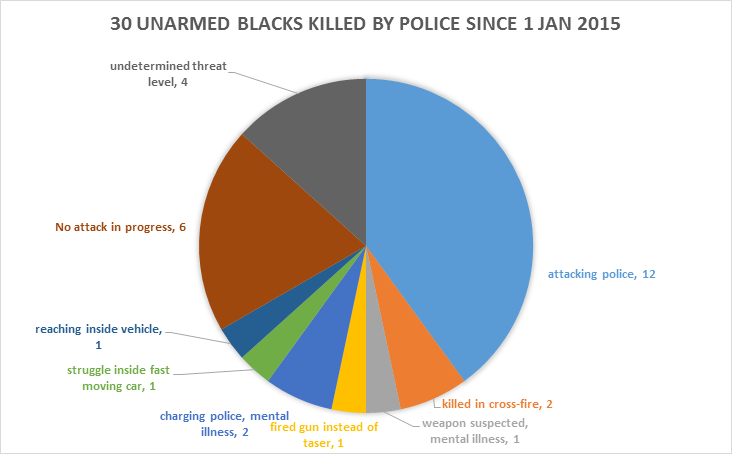
30 unarmed Blacks killed by police by threat level since 1 January 2015
20 Nov 2015 Leave a comment
in economics of crime, law and economics, politics - USA
Before I go to the coding errors by the Washington Post, two were killed by a police stray bullets so there is no intention to kill that person no matter what their race might be. One of the 30 was killed by a 74-year-old sheriff’s reserve deputy who fumbled his weapons while trying to subdue the deceased who was on the ground fighting with other officers. That was a tragic accident. There was no police intention to kill despite the negligence. Perhaps the correct number is 27.
Source: Investigation: Police shootings – Washington Post.
12 of the 30 deceased were attacking police according to the coding of the Washington Post. When you read the details of the 13 classified as no attack in progress, seven must be reclassified. A threat level makes no sense if you’re accidentally killed by police stray bullet as just mentioned.
One of the deceased got out of his car then reached inside despite police commands not to do so, but was still classified as no attack in progress. He was shot because the police thought he was going for a gun.
Three of the deceased were mentally ill, of which two are charging the police with the weapon of some sort and another look like he had a weapon. They were attacking police which is contrary to the coding of the Washington Post that they weren’t.
Another of the deceased was shot struggling with the policeman who got into the car which he then drove off in at speed. The car later crashed after the shooting.
Then we’re back to the 74-year-old sheriff’s reserve deputy who fired his gun instead of the Taser as mentioned before. That shooting too was classified as no attack in progress despite the fact the deceased was struggling with officers. The sheriff’s deputy was trying to use his Taser to subdue the man resisting arrest violently. Not sure how a policeman can confuse a gun with the Taser but it was a high stress situation of a suspect who was struggling with police.
All in all, at most 10 of the unarmed blacks deliberately shot in America this year by police were not attacking at the time.
The Guardian argues that 1013 were killed by police this year in the USA. The Washington Post puts this number at 871 as of today. Either way, about 1% of these deaths were of an unarmed black who was not attacking police. Of that 10 who were shot, a number will turn out to be justifiable shootings. A few of these police shootings will not be justified and will result in criminal prosecutions.
Police officers who shoot an unarmed suspect at a safe distance are highly likely to be charged as I have previously argued. The Washington Post confirmed that with its investigator journalism finding that only 5% of the police shootings it reviewed for 2015 were suspicious in terms of police misconduct.
How Scandinavian Countries Pay for Their Government Spending
20 Nov 2015 1 Comment
in politics - Australia, politics - New Zealand, politics - USA, Public Choice, public economics Tags: Denmark, Finland, growth of government, Norway, Scandinavia, size of government, Sweden, taxation and entrepreneurship, taxation and investment, taxation and labour supply, welfare state
@amyadamsMP Justice Michael Kirby on the battered woman’s defence
20 Nov 2015 Leave a comment
in economics of crime, law and economics, politics - New Zealand, politics - USA Tags: battered woman's defence, crime and punishment, criminal deterrence, criminal procedure, Justice Michael Kirby, law and order

JFK assassination conspiracy theories are still going strong, unfortunately
19 Nov 2015 Leave a comment
in economic history, health economics, politics - USA, Public Choice Tags: conspiracy theories, cranks, expressive voting, JFK conspiracy theorists, political psychology, Quacks, rational ignorance, rational irrationality, social psychology

..
218 Blacks killed by police since 1 January 2015 by threat level
19 Nov 2015 Leave a comment
in economics of crime, law and economics, politics - USA
Surprisingly few Blacks killed by police this year in the USA were simply unarmed – at least 13 but no more than 20 or so. Nearly all of the rest were attacking or carrying a deadly weapon.


Recent Comments