Our friends on the Left go on about how wonderful place Sweden is despite its gender gap being stuck for 35 years. Not much better in Norway and in Germany and France for that matter.
Figure 1: gender wage, % of median male wage, full-time employees, France, Germany, Sweden and Norway, 1980 – 2012
The gender wage gap in figure 1 is unadjusted and defined as the difference between median earnings of men and women relative to median earnings of men. Data refer to full-time employees.
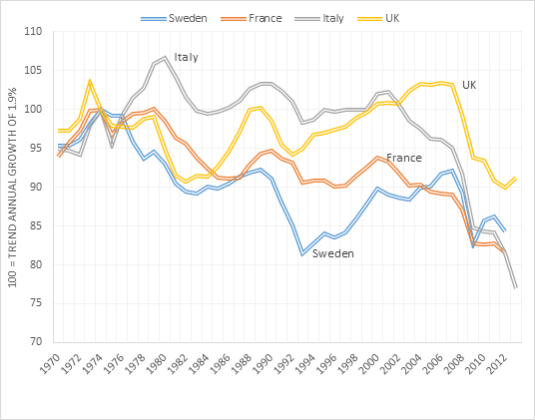
Figure 1 shows stark differences between Sweden, France, Italy and the UK since 1970 in departures from trend growth rates of 1.9% in real GDP per working age person, PPP. Italy did quite OK until 2000 growing at about the trend growth rate of 1.9% after which it fell into a hole so deep that it barely notice the onset of the global financial crisis. Sweden really had been the sick man of Europe until it turned its back on high taxing, welfare state socialism in the early 1990s. France has been in a long decline so much so that the global financial crisis is hard to pick up in the acceleration in its long decline in the mid-1990s. Figure 1 also shows Britain did very well, both under the neoliberal horrors of Thatcherism and the betrayals by Tony Blair of a true Labour Party platform. The UK grew at above the trend annual growth to 1.9% for most of the period from the early 1980s to 2007. The UK has done not so well since the onset of the global financial crisis.
Figure 1: Real GDP per Swede, French, British and Italian aged 15-64, 2014 US$ (converted to 2014 price level with updated 2011 PPPs), 1.9 per cent detrended, 1970-2013
Note: When the line is flat, the economy is growing at its trend annual growth rate. A falling line means below trend annual growth; a rising line means of above trend annual growth. Detrended with values used by Edward Prescott.
German data was not in figure 1 because German unification threw all of its data into disarray for long-term comparison purposes.
Much easier to fire someone in the USA or UK than on continental Europe. Greece and Spain aren’t that bad by continental European standards for employment law protections against dismissals of individuals.
Figure 1: Strictness of employment protection for individual dismissals, 2013
Figure 1 shows a divergence from a common starting point in 1974 effective retirement ages. The French in particular were the first to put their feet up and start retiring by the age of 60 by the early 1990. There was also a sharp increase in the average effective retirement age for men in the UK over a short decade. After that, British retirement ages for men started to climb again in the late 1990s. Figure 1 also shows that the gentle taper in the effective retirement age for American men stopped at the 1980s and started to climb again in the 2000s. The German data is too short to be of much use because of German unification. France only recently stopped seeing its effective retirement age fall and it is slightly increased recently – see figure 1
Figure 1: average effective retirement age for men, USA, UK, France and Germany, 1970 – 2012, (five-year average)
Figure 2 shows similar results for British and American women as for men in the same country shown in figure 1 . That is, falling effective retirement ages for both British and American women in the 1970s and 1980s followed by a slow climb again towards the end of 1990s. French effective retirement ages for women followed the same pattern as for French retirement ages for men – a long fall to below the age of 60 with a slight increase recently. The German retirement data suggest that effective retirement ages for German women is increasing.
Figure 2: average effective retirement age for women, USA, UK, France and Germany 1970 – 2012, (five-year average)
The writers of the Index of Economic Freedom at the Heritage foundation really loves the USA and didn’t think much of the Conservative Party – Liberal Democratic Party coalition government because labour market freedom actually fell in the UK during their administration. Bring back Tony Blair, all is forgiven. The information on their website throws no insight into why this reduction in labour market freedom in Britain happened.
Figure 1: Index of Economic Freedom, Argentina, Brazil, Chile and Venezuela, 95 – 2015
Fortunately for Germany, labour market freedom increased over the course of the global financial crisis and its aftermath. This helps explains low unemployment in Germany during that period. Nothing much happened in France in regard to labour market freedom.
Figure 1: World Bank Doing Business rankings and sub rankings for trading across the French, German, Italian, British, Canadian and US borders, 2014
Source: World Bank Doing Business database; note: cost of importing and exporting not included.
Figure 2: World Bank Doing Business rankings – cost of importing and exporting across the French, German, Italian, British, Canadian and US borders, 2014
Source: World Bank Doing Business database; note: cost of importing and exporting not included.
I have no idea why you have to pledge one third of German per capita income to start a business in Germany. It takes about a week and a half a dozen procedures to start a business in the other countries.
In New Zealand, you can start a business within the hour by registering for GST and registering your company online.
Some things are decidedly harder to do in Germany and France than for businesses in the UK. On the other hand, it is surprisingly hard to register property in all three countries including the UK after 700 years of the blessings of the British common law.
Paying taxes in Germany and France are far harder than in the UK. Don’t have anything to do with construction permits in France unless you must. It is surprisingly hard to get the electricity on in the UK and France.
The European Union must have some benefits when it comes to trading across the borders of all three countries. Only problem is in Germany where it is very difficult to start a business in the first place. Why is for a later posting.
There is surprising wide range in the World Bank Doing Business ranking of the difficulty and delays in starting a business across the OECD.
Germany is ranked 114 from the world for starting a business. New Zealand is ranked first with the USA, Italy and the UK ranked in the mid 40s in the Doing Business database.
Figure 1: Real GDP per British and French aged 15-64, converted to 2013 price level with updated 2005 EKS purchasing power parities, 1.9 per cent detrended, 1950-2013
Figure 2: Real GDP per British and French aged 15-64, converted to 2013 price level with updated 2005 EKS purchasing power parities, 1.9 per cent detrended, base 100 = 1974, 1950-2013
In figure 2, a flat line represents annual real GDP growth at a rate of 1.9%, which is the trend rate of annual growth of the USA in the 20th century. A rising line means annual growth at above that trend rate; a falling line means annual growth at below that trend rate of 1.9% per year.
Why Evolution is True is a blog written by Jerry Coyne, centered on evolution and biology but also dealing with diverse topics like politics, culture, and cats.
“We do not believe any group of men adequate enough or wise enough to operate without scrutiny or without criticism. We know that the only way to avoid error is to detect it, that the only way to detect it is to be free to inquire. We know that in secrecy error undetected will flourish and subvert”. - J Robert Oppenheimer.


Recent Comments