https://twitter.com/Brilliant_Ads/status/660046314042970113

Celebrating humanity's flourishing through the spread of capitalism and the rule of law
31 Oct 2015 Leave a comment
in economics of media and culture, international economics Tags: economics of advertising, Norway, purchasing power parity, Sweden, The Big Mac index
29 Oct 2015 Leave a comment
in industrial organisation, macroeconomics Tags: Sweden
I periodically make comparisons of the United States and Europe that are not very flattering for our cousins across the Atlantic.
Though this isn’t because of any animus toward Europe. Indeed, I always enjoy my visits. And some of America’s best (albeit eroding) features, such as rule of law and dignity of the individual, are a cultural inheritance from that continent.
 Nor am I trying to overstate America’s competitiveness, which actually has eroded considerably during this century.
Instead, I’m simply trying to make the narrow point that too much government is already causing serious problems in Europe, and I’m worried those problems are spreading to the United States.
Yet some of our statist friends, most notably Senator Bernie Sanders, think America should deliberately choose to be more like Europe.
They have this halcyon vision that the average European is more prosperous and they exclaim that this is proof that…
View original post 1,133 more words
25 Oct 2015 Leave a comment
in applied welfare economics, economic growth, economic history, macroeconomics, Marxist economics Tags: endogenous growth theory, envy, Leftover Left, politics of envy, Sweden, top 1%
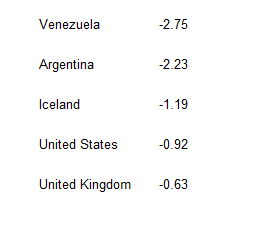
#Sweden: Inequality decreased hugely in the 20th century – but is now rising.
bit.ly/1DEBY1P https://t.co/MHPgp29AWZ—
Max Roser (@MaxCRoser) October 24, 2015
A fall in the share of the top 1% of total Swedish total incomes was in tune with the emergence of a new word in the English language which was Swedosclerosis. That was the long stagnation in the Swedish economy in the 1970s and the 1980s with Swedish economic growth well below that in the trend rate of growth in the USA. Only after an increase in the top 1% share in Sweden did economic growth start recovering to trend.
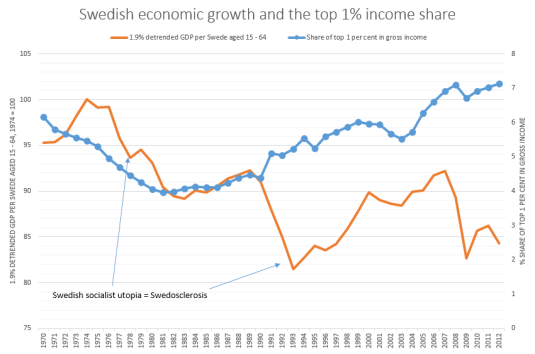
Source: Computed from OECD StatExtract and The Conference Board. 2015. The Conference Board Total Economy Database™, May 2015, http://www.conference-board.org/data/economydatabase/
In the chart above, a flat-line in real GDP per working age Swede is growth at the trend rate of the US economy for the 20th century which was 1.9% per year. A falling line is Swedish growth below trend, a rising line is growth above that trend rate of 1.9% in Sweden. A trend rate of 1.9% is the trend rate of growth currently used by Edward Prescott for the USA in the 20th century.
22 Oct 2015 Leave a comment
in discrimination, gender, labour economics Tags: compensating differentials, gender wage gap, maternity leave, social insurance, Sweden
Whatever else a generous welfare state, high taxes and lavish maternity leave may do, they haven’t made more than a scratch on the Swedish gender pay gap for 35 years at least.
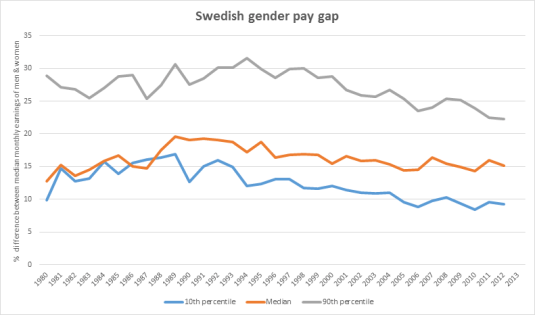
Source: OECD Employment Database.
24 Sep 2015 Leave a comment
in economic history Tags: British disease, British economy, Common market, customs unions, Denmark, European Union, Margaret Thatcher, Sweden, Swedosclerosis

Source: Computed from OECD StatExtract and The Conference Board. 2015. The Conference Board Total Economy Database™, May 2015, http://www.conference-board.org/data/economydatabase/

Source: Computed from OECD StatExtract and The Conference Board. 2015. The Conference Board Total Economy Database™, May 2015, http://www.conference-board.org/data/economydatabase/
The data is detrended at 1.9% per year – the trend rate of growth for the USA in the 20th century. A rising line means growth greater than 1.9% for that year, a falling line means growth of less than 1.9% for the year. A flat line is growth of 1.9% for that year.
Britain, Sweden and Denmark all grew quickly up until the 1970s in a period known as post-war catch up.In the 1970s and early 1980s, there was the British disease. The 1970s to the early 1990s was Swedosclerosis. There was a boom in the British economy subsequent to the economics of Mrs Thatcher.
17 Sep 2015 Leave a comment
in economic history, urban economics Tags: Finland, Generation Rent, housing affordability, housing prices, land supply, land use planning, NIMBYs, Norway, Sweden, zoning

Source: International House Price Database – Dallas Fed
Note: The house price index series is an index constructed with nominal house price data. The real house price index is an index calculated by deflating the nominal house price series with a country’s personal consumption expenditure deflator.
16 Aug 2015 Leave a comment
in applied welfare economics, business cycles, constitutional political economy, economic history, job search and matching, labour economics, labour supply, macroeconomics, Public Choice, unemployment Tags: borders, deployment subsidies, economics of borders, equilibrium unemployment rate, Finland, labour market programs, long-term unemployment, maps, natural unemployment rate, Norway, Scandinavia, search and matching, Sweden, unemployment durations
As I recall, most unemployed have been unemployed longer than 12 months in Sweden have to go on a labour market program. When they returned to unemployment after the program, the clock starts again. They are deemed to be freshly unemployed rather than adding to the previous spell with an interlude on a make work program. This makes Swedish long-term unemployment data rather unintelligible.

Source: OECD StatExtract.
Finland was recovering from its worst depression since the 1930s and the early 1990s when its data on long-term unemployment started to be continuous. This makes Finnish unemployment data rather difficult to interpret. Norway’s data for the long-term unemployed goes up and down a bit too much to be trustworthy without a background policy narrative.
15 Aug 2015 Leave a comment
in economic history, labour economics, unions Tags: Denmark, Finland, Norway, Sweden, union membership, union power, union wage premium
Union membership has been very high all the time in Norway, Sweden, Denmark and Finland.

Source: OECD Stat Extract.
10 Aug 2015 1 Comment
in applied price theory, applied welfare economics, comparative institutional analysis, currency unions, economic growth, economic history, economics of regulation, entrepreneurship, Euro crisis, fiscal policy, global financial crisis (GFC), income redistribution, labour economics, labour supply, macroeconomics, Marxist economics, poverty and inequality, Public Choice, public economics, rentseeking Tags: British disease, entrepreneurial alertness, Eurosclerosis, France, German unification, Germany, growth of government, sick man of Europe, social insurance, Sweden, taxation and entrepreneurship, taxation and investment, taxation and labour supply, welfare state
The Washington Centre for Equitable Growth recently tweeted that inequality harms growth in the USA as compared to Sweden, France, Germany and the UK. It was relying on some dodgy OECD research.
.@OECD sees continued rise in growth-harming inequality, reports @PaulHannon29 on.wsj.com/1EZpq1S http://t.co/xt4heZysXT—
Equitable Growth (@equitablegrowth) May 21, 2015
The Washington Centre for Equitable Growth did not check their inequality ratios they tweeted against trends in economic growth and economic policy since 1970, which I have reproduced in figure 1. Germany is not included in figure 1 because German data on growth is thrown askew by German unification.
Figure 1: Real GDP per British, French and Swede aged 15-64, 2014 US$ (converted to 2014 price level with updated 2011 PPPs), 1.9 per cent detrended, 1970-2013

Source: Computed from OECD Stat Extract and The Conference Board. 2015. The Conference Board Total Economy Database™, May 2015, http://www.conference-board.org/data/economydatabase/
Figure 1 shows that France has been in a long-term decline since the late 1970s despite the blessings of a more equal society than the USA as championed by the Washington Centre for Equitable Growth. In figure 1, a flat line is growth in real GDP per working age person, PPP, at the same rate as the USA for the 20th century, which was 1.9% per year. A falling line in figure 1 indicates growth of less than 1.9% while a rising line indicates growth in real GDP per working age person, PPP, in excess of 1.9%. In figure 1, France hardly ever grew at the trend rate of growth for the USA of 1.9% per year and was frequently well below that rate.

Sweden tells a slightly different story in figure 1 because of regime change in the early 1990s when Sweden adopted more liberal economic policies where taxes and government spending were reduced:
The rapid growth of the state in the late 1960s and 1970s led to a large decline in Sweden’s relative economic performance. In 1975, Sweden was the 4th richest industrialised country in terms of GDP per head. By 1993, it had fallen to 14th.
@alexvoronov använda smygfinansiering av Generell Välfärd är alltid av ondo. @NimaSanandaji: bit.ly/1Nar2eV http://t.co/wD0YEgncIE—
Old Whig (@aClassicLiberal) August 05, 2015
That regime change reversed a long economic decline since 1970 under the egalitarian policies of the Swedish Social Democratic Party. Under the Swedish Social Democratic Party, Sweden was almost always growing at less than the trend rate of growth of the USA, which was 1.9%. That position reversed only when there was a turn away from big government and high taxes.

Figure 1 tells a similar story for the British economy: a long economic decline in the 1970s when Britain was the sick man of Europe. Under Thatchernomics, Europe had a long economic boom for 20 years or more – see figure 1.
In the 1970s, under the high taxes of the Heath, Callaghan and Wilson administrations, as figure 1 shows, Britain was the sick man of Europe. With the election of the Thatcher Government, Britain soon grew at better than the US trend growth rate for nearly 20 years through few exceptions.
Graph of the Day: The UK has among the lowest total tax rates on businesses in the G7 http://t.co/l6mMhN9yLD—
CPS Think Tank (@CPSThinkTank) August 04, 2015
10 Aug 2015 Leave a comment
in applied welfare economics, comparative institutional analysis, economic growth, economic history, economics of regulation, industrial organisation, labour economics, labour supply, macroeconomics, survivor principle Tags: Eurosclerosis, Sweden, taxation and entrepreneurship, taxation and investment, taxation and labour supply, welfare state
07 Aug 2015 Leave a comment
in applied welfare economics, fiscal policy, labour economics, politics - Australia, politics - New Zealand, politics - USA, poverty and inequality, welfare reform Tags: Denmark, Finland, life expectancies, Norway, Sweden, welfare state
New from @iealondon: Scandinavian success is not due to high taxes and welfare spending. iea.org.uk/in-the-media/p… http://t.co/QVH566KNtV—
IEA (@iealondon) July 07, 2015
05 Aug 2015 Leave a comment
in discrimination, economic history, gender, labour economics, law and economics Tags: France, gender wage gap, Germany, Leftover Left, Norway, Sweden, Twitter left
Our friends on the Left go on about how wonderful place Sweden is despite its gender gap being stuck for 35 years. Not much better in Norway and in Germany and France for that matter.
Figure 1: gender wage, % of median male wage, full-time employees, France, Germany, Sweden and Norway, 1980 – 2012

Source: Earnings and wages – Gender wage gap – OECD Data.
The gender wage gap in figure 1 is unadjusted and defined as the difference between median earnings of men and women relative to median earnings of men. Data refer to full-time employees.
05 Aug 2015 2 Comments
in currency unions, economic growth, economic history, economics of regulation, Euro crisis, fiscal policy Tags: British disease, British economy, Eurosclerosis, France, Germany, Italy, sick man of Europe, Sweden, Swedosclerosis
Figure 1 shows stark differences between Sweden, France, Italy and the UK since 1970 in departures from trend growth rates of 1.9% in real GDP per working age person, PPP. Italy did quite OK until 2000 growing at about the trend growth rate of 1.9% after which it fell into a hole so deep that it barely notice the onset of the global financial crisis. Sweden really had been the sick man of Europe until it turned its back on high taxing, welfare state socialism in the early 1990s. France has been in a long decline so much so that the global financial crisis is hard to pick up in the acceleration in its long decline in the mid-1990s. Figure 1 also shows Britain did very well, both under the neoliberal horrors of Thatcherism and the betrayals by Tony Blair of a true Labour Party platform. The UK grew at above the trend annual growth to 1.9% for most of the period from the early 1980s to 2007. The UK has done not so well since the onset of the global financial crisis.
Figure 1: Real GDP per Swede, French, British and Italian aged 15-64, 2014 US$ (converted to 2014 price level with updated 2011 PPPs), 1.9 per cent detrended, 1970-2013
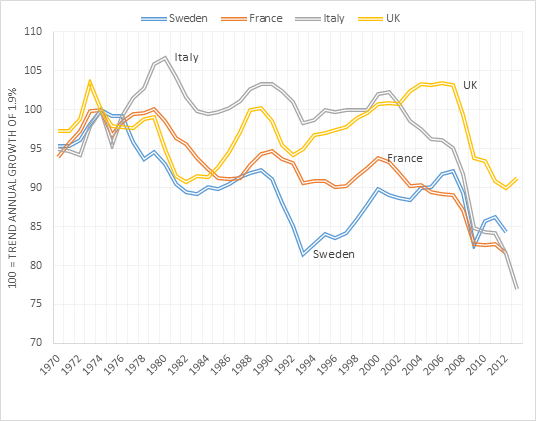
Source: Computed from OECD StatExtract and The Conference Board. 2015. The Conference Board Total Economy Database™, May 2015, http://www.conference-board.org/data/economydatabase/
Note: When the line is flat, the economy is growing at its trend annual growth rate. A falling line means below trend annual growth; a rising line means of above trend annual growth. Detrended with values used by Edward Prescott.
German data was not in figure 1 because German unification threw all of its data into disarray for long-term comparison purposes.
Celebrating humanity's flourishing through the spread of capitalism and the rule of law
Scholarly commentary on law, economics, and more
Beatrice Cherrier's blog
Celebrating humanity's flourishing through the spread of capitalism and the rule of law
Celebrating humanity's flourishing through the spread of capitalism and the rule of law
Celebrating humanity's flourishing through the spread of capitalism and the rule of law
Why Evolution is True is a blog written by Jerry Coyne, centered on evolution and biology but also dealing with diverse topics like politics, culture, and cats.
Celebrating humanity's flourishing through the spread of capitalism and the rule of law
Celebrating humanity's flourishing through the spread of capitalism and the rule of law
A rural perspective with a blue tint by Ele Ludemann
DPF's Kiwiblog - Fomenting Happy Mischief since 2003
Celebrating humanity's flourishing through the spread of capitalism and the rule of law
The world's most viewed site on global warming and climate change
Tim Harding's writings on rationality, informal logic and skepticism
A window into Doc Freiberger's library
Let's examine hard decisions!
Commentary on monetary policy in the spirit of R. G. Hawtrey
Thoughts on public policy and the media
Celebrating humanity's flourishing through the spread of capitalism and the rule of law
Politics and the economy
A blog (primarily) on Canadian and Commonwealth political history and institutions
Reading between the lines, and underneath the hype.
Economics, and such stuff as dreams are made on
"The British constitution has always been puzzling, and always will be." --Queen Elizabeth II
Celebrating humanity's flourishing through the spread of capitalism and the rule of law
Celebrating humanity's flourishing through the spread of capitalism and the rule of law
WORLD WAR II, MUSIC, HISTORY, HOLOCAUST
Undisciplined scholar, recovering academic
Celebrating humanity's flourishing through the spread of capitalism and the rule of law
Res ipsa loquitur - The thing itself speaks
Celebrating humanity's flourishing through the spread of capitalism and the rule of law
Researching the House of Commons, 1832-1868
Articles and research from the History of Parliament Trust
Reflections on books and art
Posts on the History of Law, Crime, and Justice
Celebrating humanity's flourishing through the spread of capitalism and the rule of law
Exploring the Monarchs of Europe
Cutting edge science you can dice with
Small Steps Toward A Much Better World
“We do not believe any group of men adequate enough or wise enough to operate without scrutiny or without criticism. We know that the only way to avoid error is to detect it, that the only way to detect it is to be free to inquire. We know that in secrecy error undetected will flourish and subvert”. - J Robert Oppenheimer.
The truth about the great wind power fraud - we're not here to debate the wind industry, we're here to destroy it.
Celebrating humanity's flourishing through the spread of capitalism and the rule of law
Celebrating humanity's flourishing through the spread of capitalism and the rule of law
Economics, public policy, monetary policy, financial regulation, with a New Zealand perspective
Celebrating humanity's flourishing through the spread of capitalism and the rule of law
Restraining Government in America and Around the World


Recent Comments