#Africa is turning democratic
01 Nov 2015 Leave a comment
in constitutional political economy, development economics, economic history, growth disasters, growth miracles, liberalism, Public Choice Tags: Africa, capitalism and freedom
Cuts in spending less costly than tax increases @jeremycorbyn @johnmcdonnellMP
01 Nov 2015 Leave a comment
Did government pick the Internet as a winner? @stevenljoyce @dpfdpf
31 Oct 2015 Leave a comment
in applied price theory, Austrian economics, comparative institutional analysis, economic history, economics of bureaucracy, economics of media and culture, industrial organisation, Public Choice, survivor principle Tags: creative destruction, entrepreneurial alertness, industry policy, Internet, picking losers, picking winners, The fatal conceit, The meaning of competition, The pretense to knowledge
British detrended economic growth and the top 1% income share
31 Oct 2015 1 Comment
in economic growth, economic history, macroeconomics, Marxist economics, public economics
Max Roser seems upset that British inequality rose since the 1980s for the top 1%. Other measures of inequality did not rise such as for disposable income.
https://twitter.com/MaxCRoser/status/657509056052133888
At the same time as top income shares grew at a pace, as shown in the chart below, the British economy boomed under the Thatchernomics, and if the British Left is to believed, under Thatchernomics by another name under Tony Blair. I’m not suggesting much in the way of linkages but the British Left gets excited about the relationship between top income shares and British economic prosperity. Britain grew at well above the trend rate of growth for the USA in the 20th‘s century for most of the period of Thatchernomics despite rising top 1% income shares or maybe course of that. Let’s not get carried away about linkages.
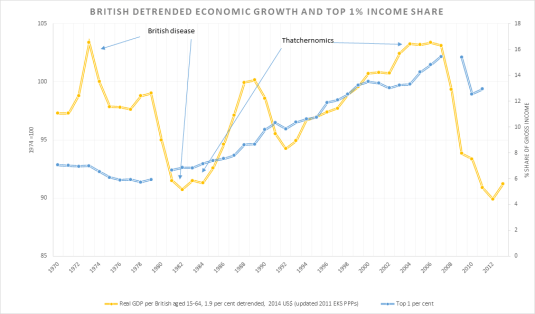
Source: Computed from OECD Stat Extract and The Conference Board. 2015. The Conference Board Total Economy Database™, May 2015, http://www.conference-board.org/data/economydatabase/ and Anthony B Atkinson and Salvatore Morelli CHARTBOOK OF ECONOMIC INEQUALITY.
In the chart above, British economic growth since 1970 is detrended by the growth rate of the USA for the 20th century. The USA is taken to be the global technological frontier. A flat-line in the chart above is British growth at the same rate the USA which is 1.9%; a rising line is growth in that year faster than trend; and a falling line is growth below the trend rate growth.
Chinese and Indian real GDP PPP since 1980
31 Oct 2015 Leave a comment
in development economics, economic history, growth miracles Tags: China, extreme poverty, India
Despite coming out of the blocks together, the Chinese economic miracle led to far larger increase in its respective real GDP PPP. Indian GDP only increased eightfold while Chinese GDP increased 18 fold since 1980 on a purchasing power parity basis.
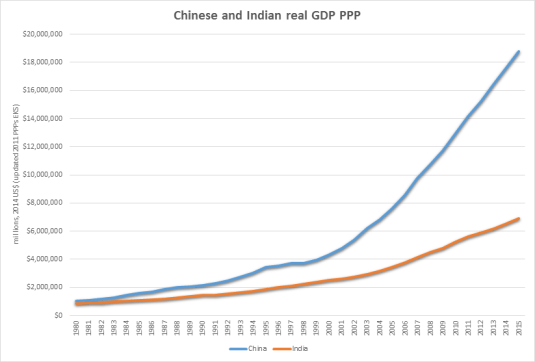
Source: The Conference Board. 2015. The Conference Board Total Economy Database™, May 2015, http://www.conference-board.org/data/economydatabase/
Creative destruction in Medicare spending
31 Oct 2015 Leave a comment
in economic history, entrepreneurship, health economics Tags: creative destruction
"1 in 3 Medicare dollars today gets spent on something that wasn't around a decade ago." –@amitabhchandra2 http://t.co/khX40YG5Bp—
The Hamilton Project (@hamiltonproj) October 11, 2015
Everything is on sale compared to 1979 @BernieSanders @jeremycorbyn
29 Oct 2015 Leave a comment
in applied welfare economics, economic history, politics - USA Tags: 2016 presidential election, good old days, Leftover Left, living standards, Twitter left
HT: Stephen Berry.
@Oxfam fewer people living in absolute poverty today than in 1820
29 Oct 2015 Leave a comment
in economic history Tags: capitalism and freedom, extreme poverty, industrial revolution, Leftover Left, The Great Enrichment, The Great Escape, The Great Fact, Twitter left
There are fewer people living in absolute poverty today than there were in 1820. buff.ly/1OlOpX3 #progress http://t.co/LfC8I5gEE9—
HumanProgress.org (@humanprogress) October 07, 2015
@oxfamnz The Great Escape from starving Africa
29 Oct 2015 Leave a comment
in development economics, economic history, growth disasters, growth miracles
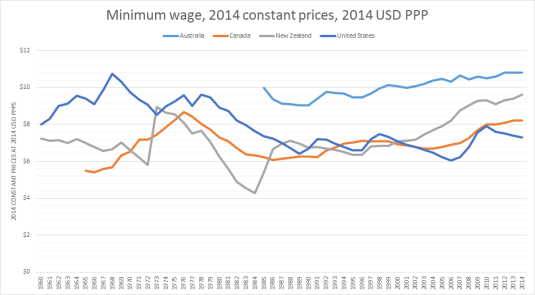
Real minimum wage PPP, USA, Canada, Australia and New Zealand since 1960
27 Oct 2015 Leave a comment
in economic history, labour economics, minimum wage
Smoking in 20th century Australia
27 Oct 2015 Leave a comment
in economic history, health economics, politics - Australia

@BernieSanders @HillaryClinton the middle class is shrinking because more people are becoming rich
27 Oct 2015 Leave a comment
in applied welfare economics, economic history, politics - USA
In 1967, only 1 in 12 US households made $100k or more per year (in 2014 dollars). Now 1 in 4 household make $100k+ https://t.co/OPnZcRsR3y—
Mark J. Perry (@Mark_J_Perry) October 26, 2015


Recent Comments