The Kuznets environmental curve describes an empirical regularity between environmental quality and economic growth. Outdoor water, air and other pollution first worse and then improves as a country first experiences economic growth and development.
While many pollutants exhibit this pattern in the Kuznets environmental curve, peak pollution levels occur at different income levels for different pollutants, countries and time periods. John Tierney explains:
There are exceptions to the trend, especially in countries with inept governments and poor systems of property rights, but in general, richer is eventually greener.
As incomes go up, people often focus first on cleaning up their drinking water, and then later on air pollutants like sulphur dioxide.
As their wealth grows, people consume more energy, but they move to more efficient and cleaner sources — from wood to coal and oil, and then to natural gas and nuclear power, progressively emitting less carbon per unit of energy.
When I was living in Japan in the mid 1990s, they just completed a period of rapid operation of the Kuznets environmental curve. I was told by my professors at Graduate School that in the 1960s, cities and prefectures welcomed polluting industries because of the better paid jobs they offered. At that time, shipping companies used like to go to Tokyo because the pollution in Tokyo Bay was so bad that it would clean all the barnacles off their ships. That made them sail faster.
Japanese incomes and wages doubled over the course of the 1960s. The Japanese voter was now prepared to support stricter pollution standards and environmental controls.
In the early 1970s, the ruling LDP stole the long-standing environmental policies of their opponents in a big crack down on pollution because the country could now afforded them.
Plenty of developing countries are democracies now. Their people could demand through the ballot box higher environmental standards and clean tap water but they don’t because of its cost to economic development.
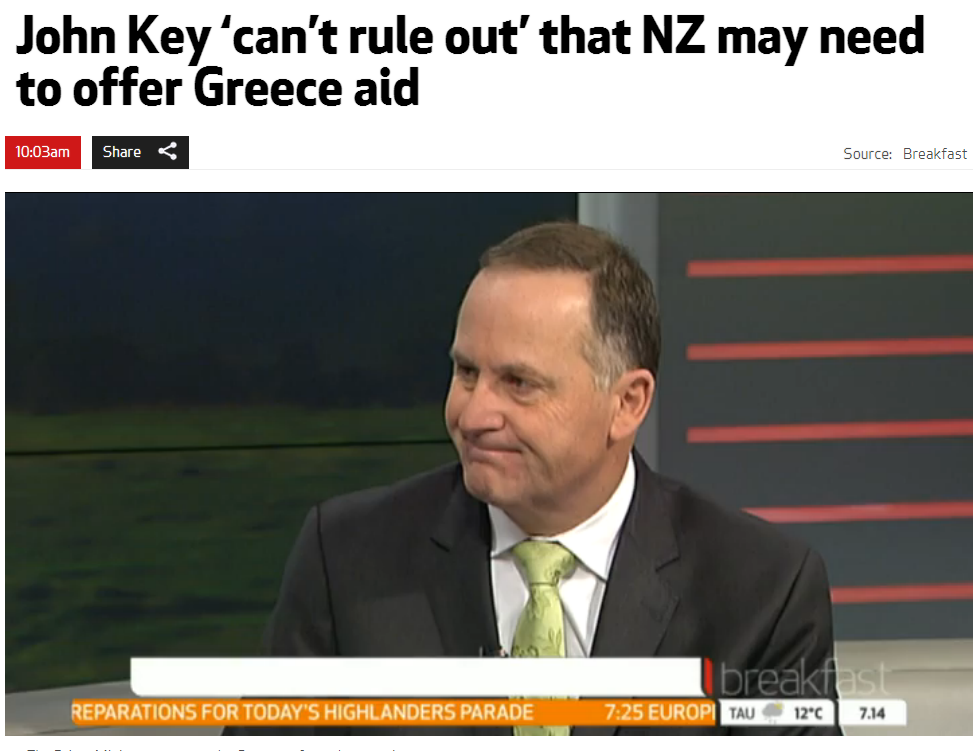
The roots of Greece’s crisis are simple. Before Greece joined the Eurozone, investors treated it as a middle-income country with poor governance — which is to say, a credit risk.
After Greece joined the Eurozone, investors thought that Greece was no longer a credit risk — they figured, if push came to shove, other Eurozone members like Germany would bail Greece out. They were wrong.
Michael Dooley put forward a theory of speculative attacks on currencies as insurance attacks on currencies for emerging markets after the East Asian financial crisis:
First generation models of speculative attacks show that apparently random speculative attacks on policy regimes can be fully consistent with rational and well-informed speculative behaviour.
Unfortunately, models driven by a conflict between exchange rate policy and other macroeconomic objectives do not seem consistent with important empirical regularities surrounding recent crises in emerging markets. This has generated considerable interest in models that associate crises with self-fulfilling shifts in private expectations.
In this paper we develop a first generation model based on an alternative policy conflict. Credit constrained governments accumulate reserve assets in order to self-insure against shocks to national consumption. Governments also insure poorly regulated domestic financial markets.
Given this policy regime, a variety of internal and external shocks generate capital inflows to emerging markets followed by successful and anticipated speculative attacks.
We argue that a common external shock generated capital inflows to emerging markets in Asia and Latin America after 1989. Country specific factors determined the timing of speculative attacks. Lending policies of industrial country governments and international organizations account for contagion, that is, a bunching of attacks over time.
His model was not within the context of a currency union but his basic theory is correct.
There are speculative attacks on a currency or a bank run after foreign markets revises their estimates of the available central bank reserves and international lines of credit to bail out the banking systems and/or foreign debt.
Greece is a tiny part of the European economies so it doesn’t matter that much to the rest of the European Union what happens to Greece. The only people will notice the sovereign default of Greece once the breathless journalism has died down are Greeks themselves as they rebuild their banking and monetary system against a background of a government run by coffee shop Marxists.
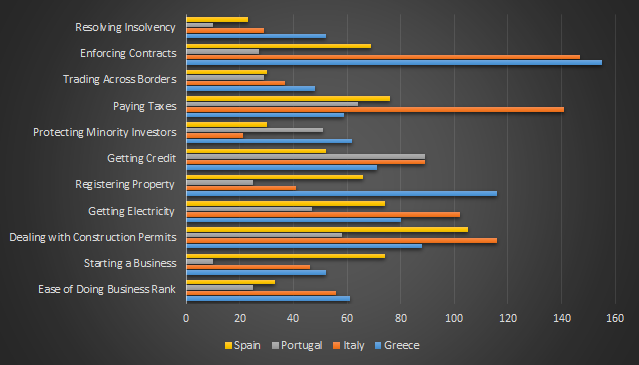
All in all, Italy and Greece are a dog of a place to enforce a contract. The long-suffering taxpayer is better off paying taxes in Greece than in Italy! Not surprisingly, trading across borders is the greatest strength in doing business in the PIGS. The European Union does have some benefits.
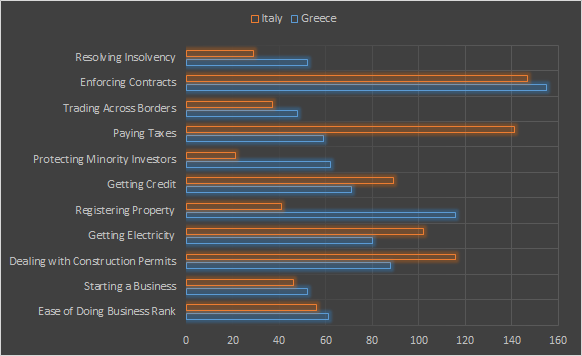
Figure 2: Doing Business rankings, Greece and Italy, 2014
All in all, Italy and Greece are equally bad places to do business and Italy is much worse when it comes to taxes. About the only saving graces of Italy is the registration of property and the protection of minority interests in companies.
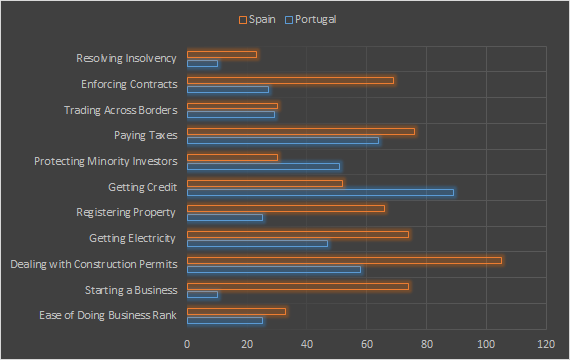
Figure 3: Doing Business rankings, Spain and Portugal, 2014
#Greece spends more on pensions as percentage of GDP (17.5% in 2012) than any other EU nation (avg 13.2%). (via BBG) http://t.co/wq2ikAtYW5— Holger Zschaepitz (@Schuldensuehner) June 01, 2015
A country that spends nearly a fifth of its GDP on old-age pensions with surprisingly few people over the age of 55 working should not be surprised when it finds itself in financial difficulty.
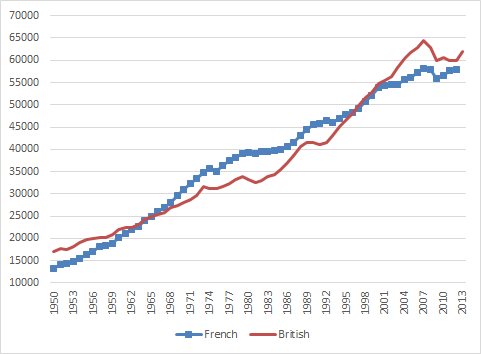
Figure 1: Real GDP per British and French aged 15-64, converted to 2013 price level with updated 2005 EKS purchasing power parities, 1.9 per cent detrended, 1950-2013
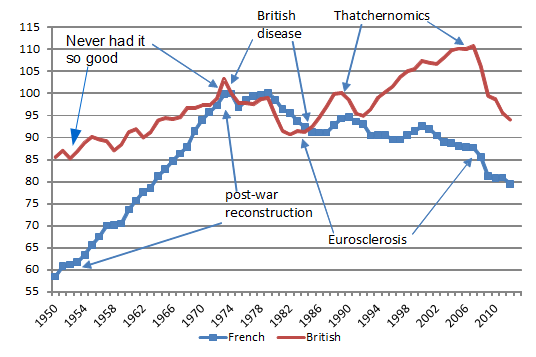
Figure 2: Real GDP per British and French aged 15-64, converted to 2013 price level with updated 2005 EKS purchasing power parities, 1.9 per cent detrended, base 100 = 1974, 1950-2013
In figure 2, a flat line represents annual real GDP growth at a rate of 1.9%, which is the trend rate of annual growth of the USA in the 20th century. A rising line means annual growth at above that trend rate; a falling line means annual growth at below that trend rate of 1.9% per year.
Why Evolution is True is a blog written by Jerry Coyne, centered on evolution and biology but also dealing with diverse topics like politics, culture, and cats.
In Hume’s spirit, I will attempt to serve as an ambassador from my world of economics, and help in “finding topics of conversation fit for the entertainment of rational creatures.”





Recent Comments