The unemployment rate was zero in New Zealand in 1956, 1957 and 1961. Apparently no one was jobless even for a day in New Zealand when changing jobs or entering or re-entering the workforce from outside employment, from school or other educational callings or as a migrant, if the OECD data is to be believed.
Unemployment was 1% for the rest of the 1960s in New Zealand before skyrocketing to 2.5% in 1975. By 1983, under the best of the good old days before the scourge of neoliberalism, unemployment rate had reached 5.5% after a steady increase from more than a decade.
The less than 1% unemployment was mostly under National Party rule but this era is looked upon with great fondness by the left-wing in New Zealand. Same in Australia where the good old days are known as the Menzies era: 23 years of Conservative party rule but beloved now by the left-wing as the ideal mixed economy.
Australian unemployment rates in the late 1960s was also pretty low given the requirements of labour market churn and entry on re-entry into the labour force.
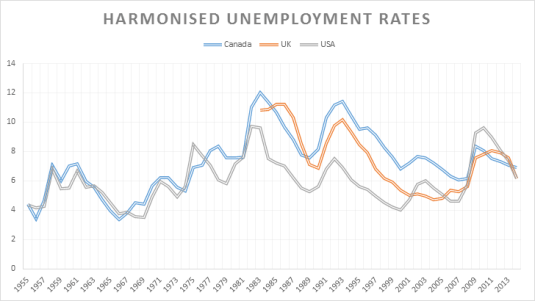
Canada has had much worse unemployment rates than the USA since the late 1970s. British unemployment rates have been doing okay since the late 1990s until the global financial crisis.
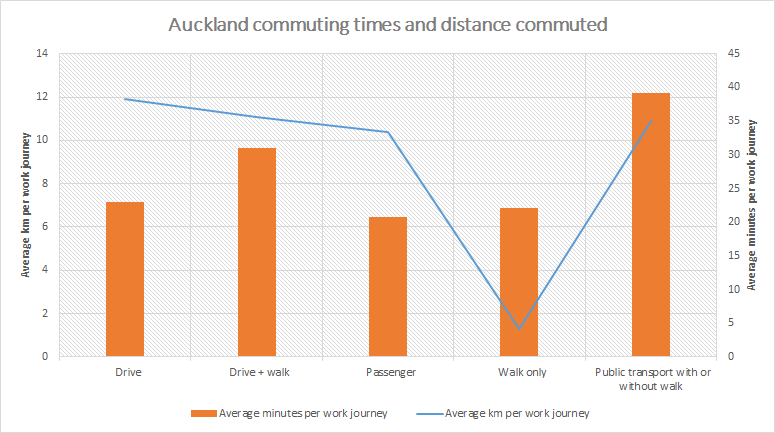
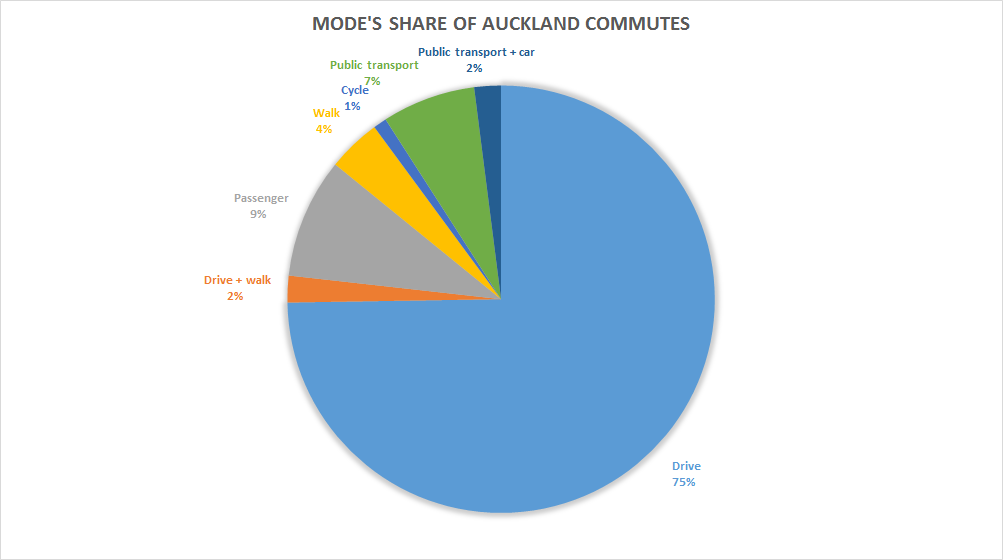
The average commute by public transport is 40 minutes as compared to less than 25 in a car. 74% of Aucklanders drive to work and another 9% are a passenger in a car.
No information was available on those who bike to work because only 1% of Aucklanders bike to work. Only 2% of all New Zealanders take a bike to work. The sample size was therefore too small. Yet another reason to ban bikes at night. Few commute on this mode of transport in Auckland.
The near identical commuting distances irrespective of the mode of transport except walking is further evidence that people are quite discerning in balancing commuting times and job selection as per the theory of compensating differentials. Indeed, average commuting times in Auckland are much the same as the average commuting time in America.
Improving the commuting times in one mode of transport will mean people simply take the mode of peak hour transport that is suddenly become less congested while others who were not going to commute at peak times or start commuting at peak times as Anthony Downs explains:
If that expressway’s capacity were doubled overnight, the next day’s traffic would flow rapidly because the same number of drivers would have twice as much road space.
But soon word would spread that this particular highway was no longer congested. Drivers who had once used that road before and after the peak hour to avoid congestion would shift back into the peak period. Other drivers who had been using alternative routes would shift onto this more convenient expressway. Even some commuters who had been using the subway or trains would start driving on this road during peak periods.
Within a short time, this triple convergence onto the expanded road during peak hours would make the road as congested as it was before its expansion.
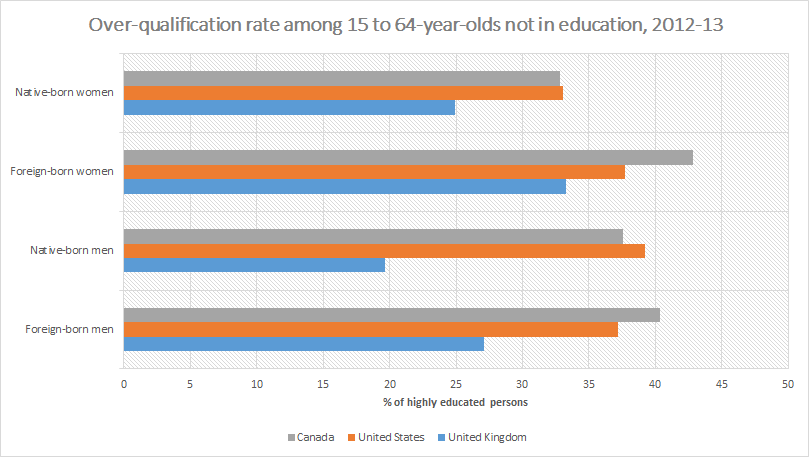
In the UK, foreign-born are much more likely to be over qualified than native born highly educated not in education with less difference between men and women. More men than women are overqualified for their jobs in the UK. Over qualification is less of a problem in the UK than in the USA and Canada.
In the USA and Canada, there are few differences between native and foreign born men in over-qualification rates. Foreign-born women tend to be more over-qualified than native born women in the USA and more so in Canada. Many more workers are overqualified for their jobs in the USA and Canada as compared to the UK.
There are large differences in the percentage of people with tertiary degrees and the education premium between these three countries that are outside the scope of this blog post. These trends may explain differences in the degree of educational mismatch.
To begin with, under human capital theories of labour market and job matching, what appears to be over-schooling substitutes for other components of human capital, such as training, experience and innate ability. Not surprisingly, over-schooling is more prominent among younger workers because they substitute schooling for on-the-job training. A younger worker of greater ability may start in a job below his ability level because he or she expects a higher probability to be promoted because of greater natural abilities. Sicherman and Galor (1990) found that:
overeducated workers are more likely to move to a higher-level occupation than workers with the required level of schooling
Investment in education is a form of signalling. Workers invest so much education that they appear to be overqualified in the eyes of officious bureaucrats. The reason for this apparent overinvestment is signalling superior quality as a candidate. Signalling seems to be an efficient way of sorting and sifting among candidates of different ability. The fact that signalling survives in market competition suggests that alternative measure ways of measuring candidate quality that a more reliable net of costs are yet to be discovered.
Highly educated workers, like any other worker, must search for suitable job matches. Not surprisingly, the first 5 to 10 years in the workforce are spent in half a dozen jobs as people seek out the most suitable match in terms of occupation, industry and employer. Some of these job seekers who are highly educated will take less suitable jobs while they search on-the-job for better matches. Nothing is free or instantly available in life including a good job match.
A more obvious reason for over qualification is some people like attending university and other forms of education for the sheer pleasure of it.
Anyone who encounters the words over-qualified and over-educated should immediately recall concepts such as the pretence to knowledge, the fatal conceit, and bureaucratic busybodies. As Edwin Leuven and Hessel Oosterbeek said recently:
The over-education/mismatch literature has for too long led a separate life of modern labour economics and the economics of education.
We conclude that the conceptional measurement of over-education has not been resolved, omitted variable bias and measurement error are too serious to be ignored, and that substantive economic questions have not been rigorously addressed.
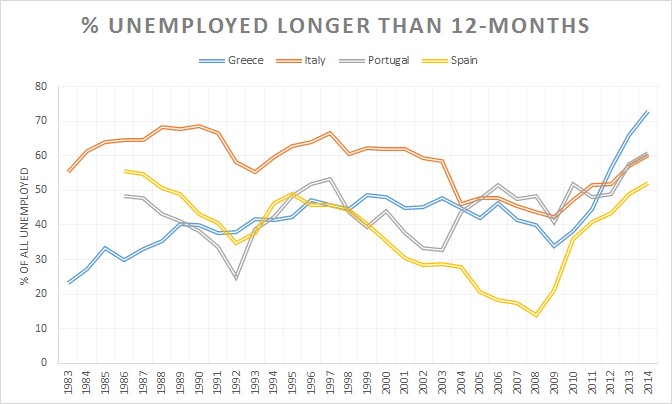
The boom that preceded the bust in the Greek economy did nothing for the rate of long-term unemployment among Greeks. Long-term unemployment had been pretty stable prior to the economic boom after joining the euro currency union.
Source: OECD StatExtract.
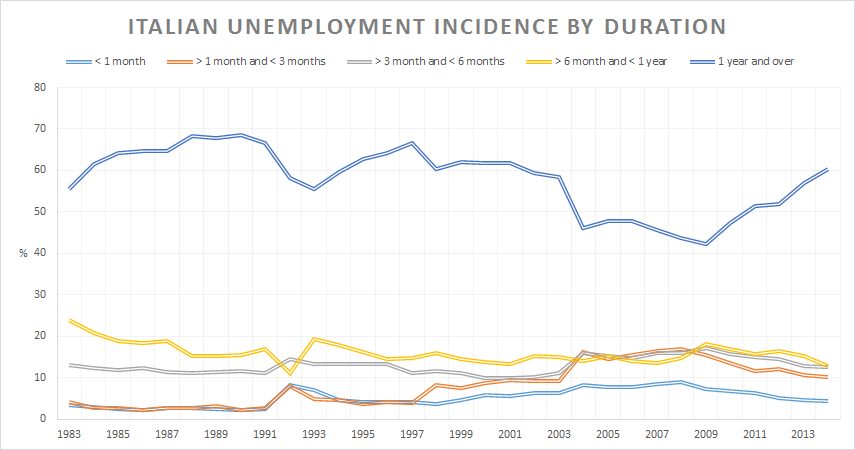
Nothing much happened to long-term unemployment in Italy or Portugal in recent decades. Spanish long-term unemployment fell in line with the economic boom in Spain over the 1980s and 1990s up until the global financial crisis.
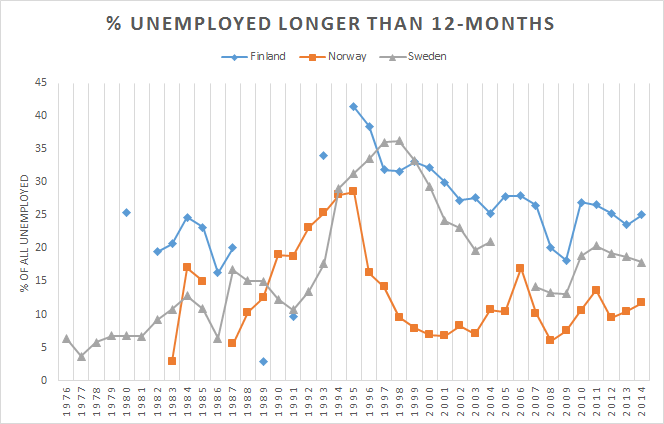
As I recall, most unemployed have been unemployed longer than 12 months in Sweden have to go on a labour market program. When they returned to unemployment after the program, the clock starts again. They are deemed to be freshly unemployed rather than adding to the previous spell with an interlude on a make work program. This makes Swedish long-term unemployment data rather unintelligible.
Source: OECD StatExtract.
Finland was recovering from its worst depression since the 1930s and the early 1990s when its data on long-term unemployment started to be continuous. This makes Finnish unemployment data rather difficult to interpret. Norway’s data for the long-term unemployed goes up and down a bit too much to be trustworthy without a background policy narrative.
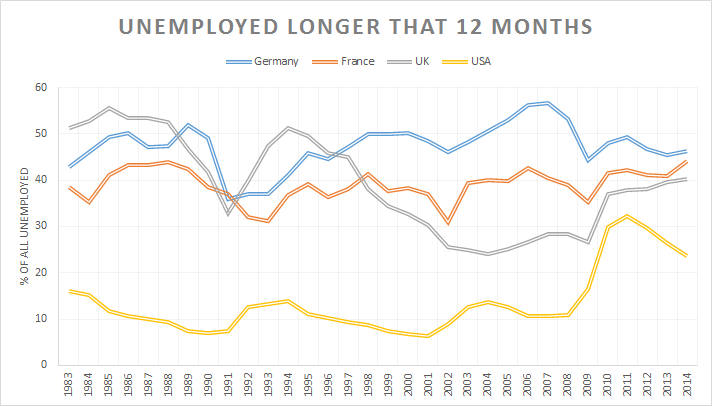
As the British labour market and long-term unemployment was starting to get something like that in the USA, the USA started to have unemployment it was more like the European labour markets in terms of the number of long-term unemployed. Nothing much happened in Germany and France.
German long term unemployment has been pretty stable albeit with an up-and-down after German unification. There is also a fall in long-term unemployment after some labour market reforms around 2005.
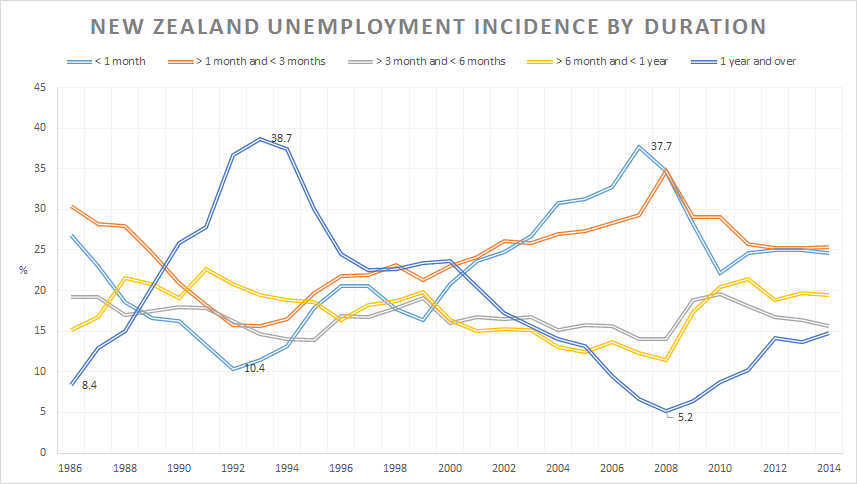
There has been bit of a wild ride in long-term unemployment in New Zealand. Long-term unemployment – longer than one year – ranging from just over 8% of unemployment in 1986 to nearly 40% in 1992 then down to 5% in 2008. Clearly the duration of unemployment in New Zealand is highly sensitive to the business cycle unlike the case in the USA or UK.
Source: OECD StatExtract.
This sensitivity of long-term unemployment to the business cycle does not bode well for the hypothesis of hysteresis where human capital depreciates the longer a jobseeker is out of employment. For this hypothesis to hold, there must be some enduring aspect of long-term unemployment rather than just going up and down with the business cycle rather noticeably.
Why Evolution is True is a blog written by Jerry Coyne, centered on evolution and biology but also dealing with diverse topics like politics, culture, and cats.
In Hume’s spirit, I will attempt to serve as an ambassador from my world of economics, and help in “finding topics of conversation fit for the entertainment of rational creatures.”






Recent Comments