Economists: They refuse to accept low interest rates! http://t.co/WyTlm6L1KS—
Tim Fernholz (@TimFernholz) August 18, 2015
Forecasting is not getting any easier
28 Aug 2015 Leave a comment
in business cycles, financial economics, macroeconomics, monetary economics Tags: forecasting errors, monetary policy, The fatal conceit, The pretence to knowledge
The ups and downs of the Greek economy
25 Aug 2015 1 Comment
in budget deficits, business cycles, currency unions, economic history, Euro crisis, fiscal policy, macroeconomics, Public Choice, rentseeking Tags: Eurosclerosis, Greece, sovereign debt crisis, sovereign defaults
@ObsoleteDogma @rodrikdani http://t.co/xKx43wjWHy—
David Andolfatto (@dandolfa) June 30, 2015
Could Wealth Redistribution End Global Poverty?
24 Aug 2015 Leave a comment
in development economics, economic growth, economic history, growth disasters, growth miracles, liberalism Tags: capitalism and freedom, extreme poverty, global poverty, The Great Enrichment, The Great Fact
@NZGreens @TransportBlog cars rule in Auckland! Auckland commuting times by transport mode
21 Aug 2015 1 Comment
in job search and matching, labour economics, occupational choice, politics - New Zealand, transport economics, urban economics Tags: Auckland, bicycles, commuting times, compensating differentials, expressive voting, green rent seeking, Inner-city Left, New Zealand Greens, public transport, rational irrationality, search and matching, The fatal conceit, The pretense to knowledge
I am not surprised only 7% of Auckland’s take public transport to work considering it takes much longer than any other form of commuting.
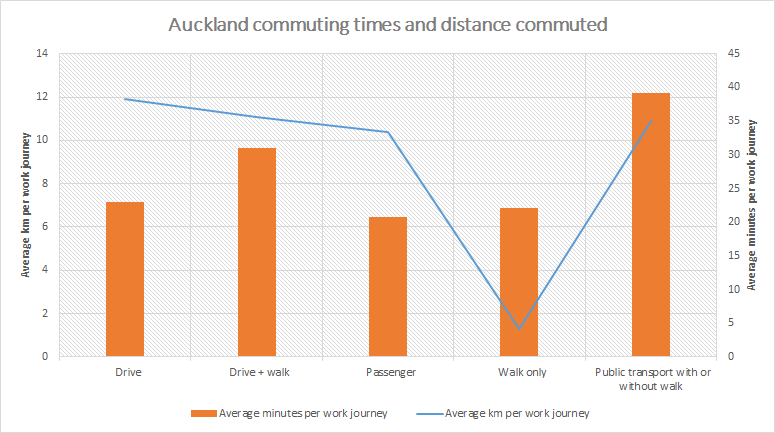
The average commute by public transport is 40 minutes as compared to less than 25 in a car. 74% of Aucklanders drive to work and another 9% are a passenger in a car.
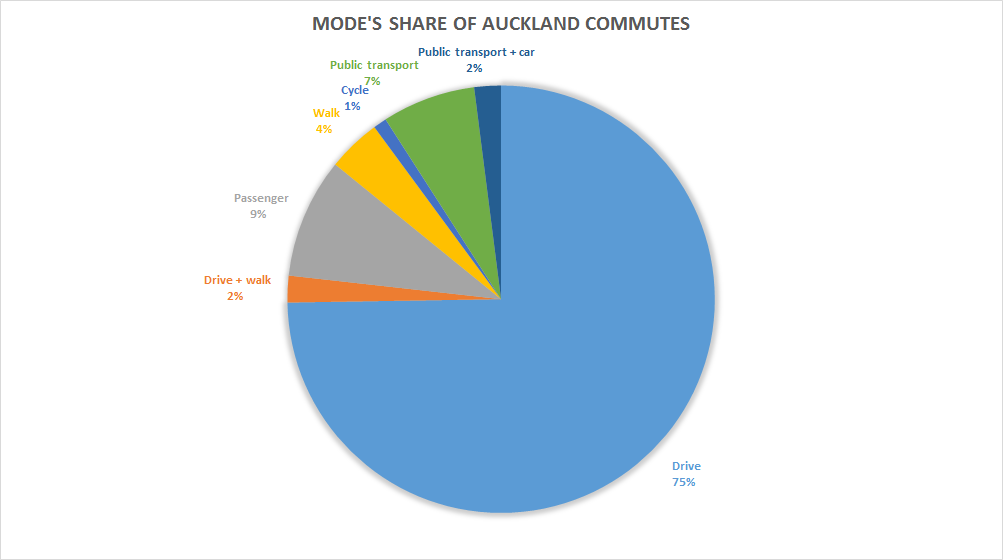
No information was available on those who bike to work because only 1% of Aucklanders bike to work. Only 2% of all New Zealanders take a bike to work. The sample size was therefore too small. Yet another reason to ban bikes at night. Few commute on this mode of transport in Auckland.
The near identical commuting distances irrespective of the mode of transport except walking is further evidence that people are quite discerning in balancing commuting times and job selection as per the theory of compensating differentials. Indeed, average commuting times in Auckland are much the same as the average commuting time in America.

The Auckland transport data showing people commute much the same distance by any mode of transport bar walking also validates Anthony Downs’ theory of triple convergence.

Improving the commuting times in one mode of transport will mean people simply take the mode of peak hour transport that is suddenly become less congested while others who were not going to commute at peak times or start commuting at peak times as Anthony Downs explains:
If that expressway’s capacity were doubled overnight, the next day’s traffic would flow rapidly because the same number of drivers would have twice as much road space.
But soon word would spread that this particular highway was no longer congested. Drivers who had once used that road before and after the peak hour to avoid congestion would shift back into the peak period. Other drivers who had been using alternative routes would shift onto this more convenient expressway. Even some commuters who had been using the subway or trains would start driving on this road during peak periods.
Within a short time, this triple convergence onto the expanded road during peak hours would make the road as congested as it was before its expansion.
Marginal tax rate of average earners in USA, UK, Australia and New Zealand since 2000
21 Aug 2015 Leave a comment
in applied price theory, business cycles, economic growth, economic history, labour economics, labour supply, macroeconomics, politics - Australia, politics - New Zealand, politics - USA, public economics Tags: Australia, British economy, productivity shocks, real business cycles, taxation and labour supply
Interesting to notice that in New Zealand and the USA after these increases in marginal tax rates on single taxpayers, their economies slowed down. What appears to have happened is a number of people reached the next income tax marginal tax rate threshold.
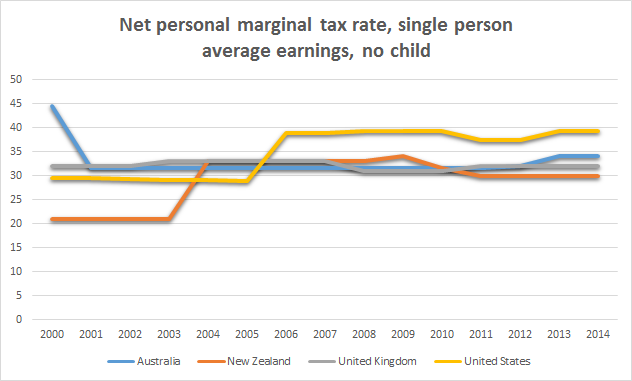
Source: OECD StatExtract.
The current sizes of government
19 Aug 2015 Leave a comment
in fiscal policy, Public Choice Tags: size of government
Marginal tax rates of New Zealand average households since 2000
19 Aug 2015 Leave a comment
in economic growth, fiscal policy, labour economics, labour supply, macroeconomics, politics - Australia, politics - New Zealand Tags: Australia, lost decades, marriage and divorce, productivity shocks, real business cycles, taxation and labour supply
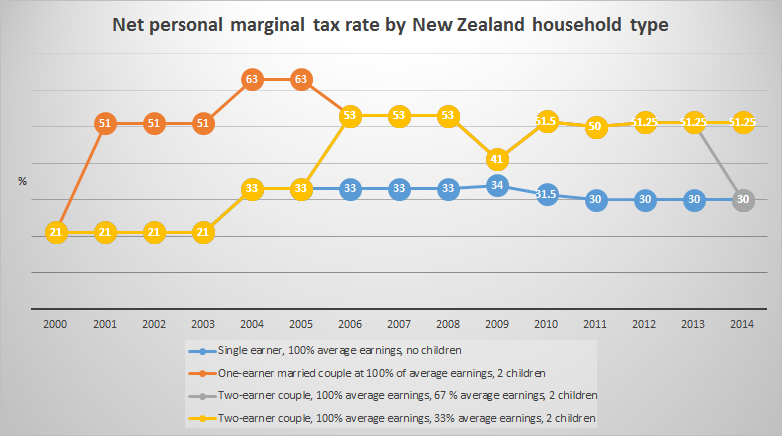
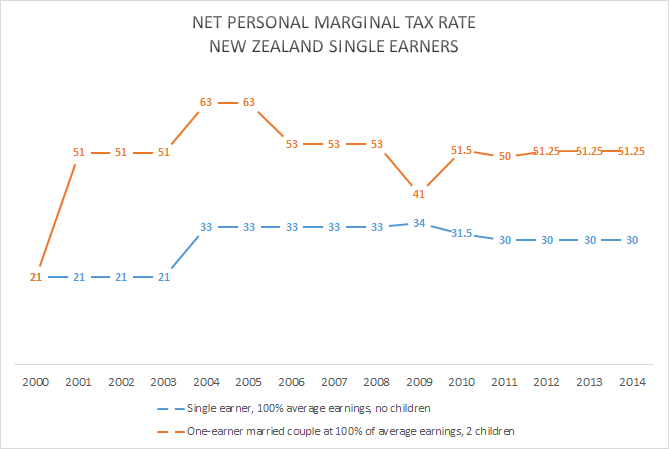
In 2000 in New Zealand, the marginal tax rates of single earners, married couples and dual income couples were 21%.
Sources: OECD StatExtract.and OECD Taxing Wages.
Net personal marginal income tax rates increased:
- to 51% for one earner couples with two children in 2001 and stayed up above 50% until 2014; and
- to 33% for single earners with no children in 2004 because income growth pushed them into the next tax rate bracket which then dropped down to 30% in 2011.
Sources: OECD StatExtract.and OECD Taxing Wages.
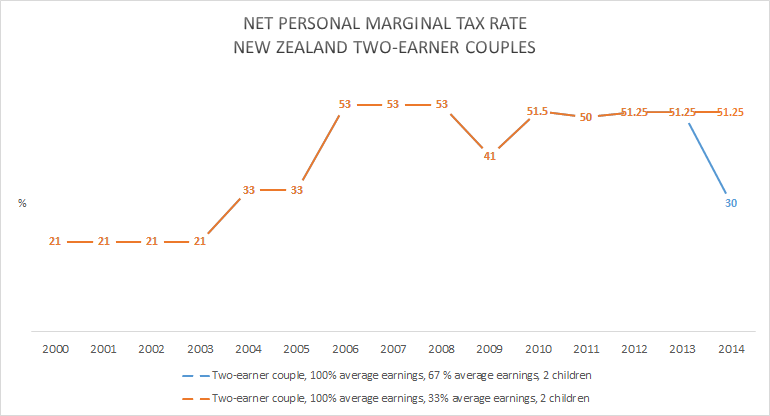
Net personal marginal income tax rates increased:
- to 33% in 2004 for two earner couples with the second earner earning 33% of average earnings and then increased to 53% in 2006 and stayed high thereafter;
- to 33% in 2004 for a two earner couple with the second earner earning 67% of average earnings and then increased further to 53% in 2006 and stayed high until 2014 when their marginal income tax rate dropped to 30%; and
Sources: OECD StatExtract.and OECD Taxing Wages.
These large increases in marginal tax rates on single earners and families coincided with a slowing of the economy in about 2005. The economy started to pick up again when there were tax cuts introduced by the incoming National Party Government. Is that more than a coincidence?
Sources: Computed from OECD StatExtract and The Conference Board. 2015. The Conference Board Total Economy Database™, May 2015, http://www.conference-board.org/data/economydatabase/.
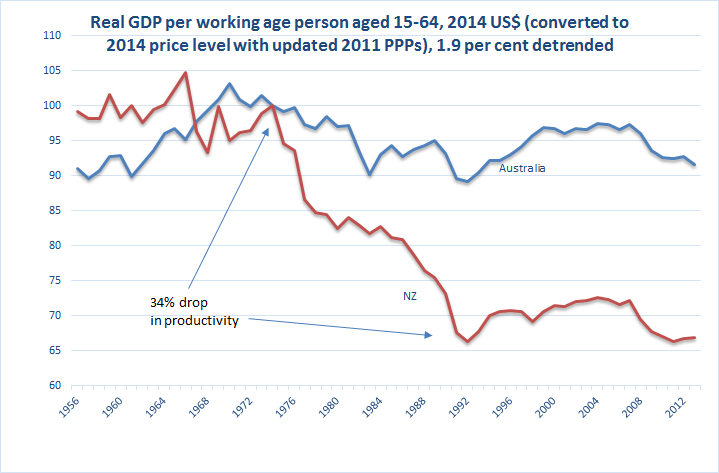
A flat line in the above figure is growth at the trend growth rate of 1.9% of the USA in the 20th century. A rising line is above trend growth for that year while a falling lined is below trend rate in GDP per working age person.
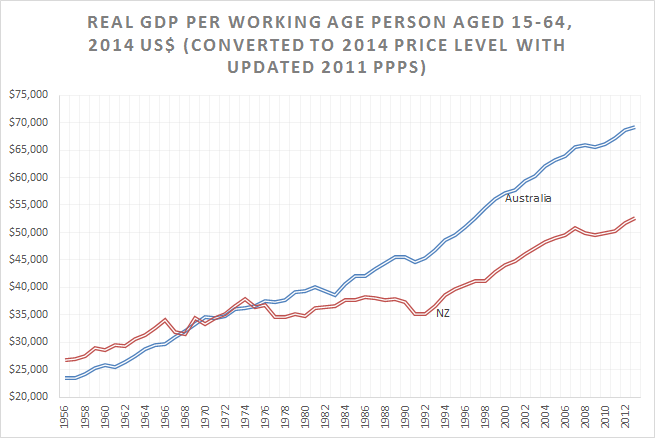
In the lost decades of New Zealand growth between 1974 In 1992, New Zealand lost 34% against trend growth which was never recovered. There was about 13 years of sustained growth at about the trend rate or slightly above that between 1992 and 2005. The entire income gap between Australia and New Zealand open up during these lost decades of growth between 1974 and 1992.
Sources: Computed from OECD StatExtract and The Conference Board. 2015. The Conference Board Total Economy Database™, May 2015, http://www.conference-board.org/data/economydatabase/.
Australia grew pretty much in its trend rate of growth since the 1950s. The so-called resources boom is not visible such as showing up as above trend rate growth.
Over-qualification rates in jobs in the USA, UK and Canada
19 Aug 2015 2 Comments
in economics of bureaucracy, economics of education, human capital, job search and matching, labour economics, labour supply, occupational choice, politics - USA, Public Choice Tags: British economy, Canada, compensating differentials, job shopping, offsetting behaviour, on-the-job training, search and matching, The fatal conceit, The pretense to knowledge
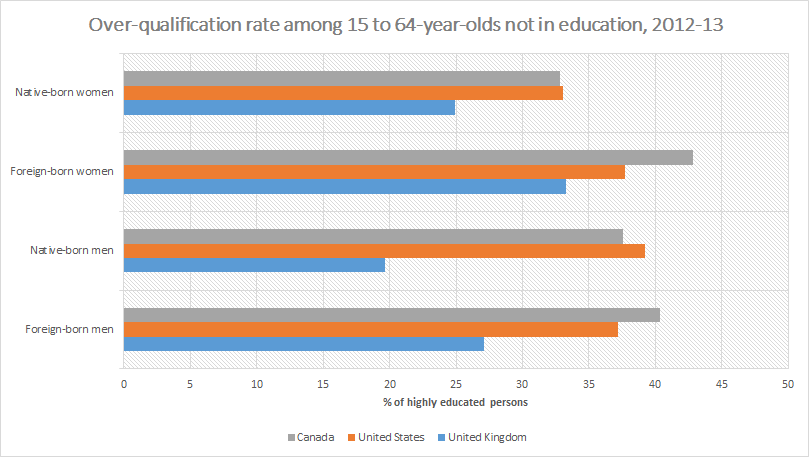
In the UK, foreign-born are much more likely to be over qualified than native born highly educated not in education with less difference between men and women. More men than women are overqualified for their jobs in the UK. Over qualification is less of a problem in the UK than in the USA and Canada.
Source: OECD (2015) Indicators of Immigrant Integration 2015: Settling In.
In the USA and Canada, there are few differences between native and foreign born men in over-qualification rates. Foreign-born women tend to be more over-qualified than native born women in the USA and more so in Canada. Many more workers are overqualified for their jobs in the USA and Canada as compared to the UK.
There are large differences in the percentage of people with tertiary degrees and the education premium between these three countries that are outside the scope of this blog post. These trends may explain differences in the degree of educational mismatch.
It goes without saying that the concept of over-qualification and over-education based mismatch in the labour market is ambiguous, if not misleading and a false construct.
To begin with, under human capital theories of labour market and job matching, what appears to be over-schooling substitutes for other components of human capital, such as training, experience and innate ability. Not surprisingly, over-schooling is more prominent among younger workers because they substitute schooling for on-the-job training. A younger worker of greater ability may start in a job below his ability level because he or she expects a higher probability to be promoted because of greater natural abilities. Sicherman and Galor (1990) found that:
overeducated workers are more likely to move to a higher-level occupation than workers with the required level of schooling
Investment in education is a form of signalling. Workers invest so much education that they appear to be overqualified in the eyes of officious bureaucrats. The reason for this apparent overinvestment is signalling superior quality as a candidate. Signalling seems to be an efficient way of sorting and sifting among candidates of different ability. The fact that signalling survives in market competition suggests that alternative measure ways of measuring candidate quality that a more reliable net of costs are yet to be discovered.
A thoroughly disheartening chart if you're a graduate in the UK i100.io/mpDbJAl http://t.co/mv9izA0mbc—
i100 (@thei100) August 20, 2015
Highly educated workers, like any other worker, must search for suitable job matches. Not surprisingly, the first 5 to 10 years in the workforce are spent in half a dozen jobs as people seek out the most suitable match in terms of occupation, industry and employer. Some of these job seekers who are highly educated will take less suitable jobs while they search on-the-job for better matches. Nothing is free or instantly available in life including a good job match.
A more obvious reason for over qualification is some people like attending university and other forms of education for the sheer pleasure of it.
Anyone who encounters the words over-qualified and over-educated should immediately recall concepts such as the pretence to knowledge, the fatal conceit, and bureaucratic busybodies. As Edwin Leuven and Hessel Oosterbeek said recently:
The over-education/mismatch literature has for too long led a separate life of modern labour economics and the economics of education.
We conclude that the conceptional measurement of over-education has not been resolved, omitted variable bias and measurement error are too serious to be ignored, and that substantive economic questions have not been rigorously addressed.
The benefits and costs of the @NZSuperFund since its inception
17 Aug 2015 Leave a comment
in applied price theory, applied welfare economics, economic growth, economic history, entrepreneurship, financial economics, fiscal policy, industrial organisation, labour economics, labour supply, macroeconomics, politics - New Zealand, public economics Tags: ageing society, company tax rate, deadweight cost of taxes, demographic crisis, efficient markets hypothesis, laffer curve, New Zealand superannuation fund, old age pensions, retirement savings, social insurance, sovereign wealth funds, taxation and entrepreneurship, taxation and investment, taxation and labour supply
Most mutual funds still can't beat their benchmark read.bi/1GkTig1 http://t.co/r7ezoDGJbV—
BI Chart of the Day (@chartoftheday) June 03, 2015
The New Zealand Superannuation Fund, the sovereign wealth fund part funding New Zealand’s old-age pension from 2029/2030 onwards, has been a bit of a wild ride. Sometimes the earnings of the Fund were well below and sometimes earning well above the long-term bond rate.
![image_thumb[3]](https://utopiayouarestandinginit.com/wp-content/uploads/2015/08/image_thumb310.png "image_thumb[3]")
Source: New Zealand Superannuation Fund Annual Report 2014.
Since its inception, the Fund earned an average annual return of 9.78%, which was 5.06% above the long-term bond rate, and 1.03% above its reference portfolio.

No information was given in the annual report of the New Zealand Superannuation Fund on the marginal dead weight cost of the taxes raised to fund the New Zealand Superannuation Fund to see whether there is any net benefit to taxpayers from its establishment and continued operation.
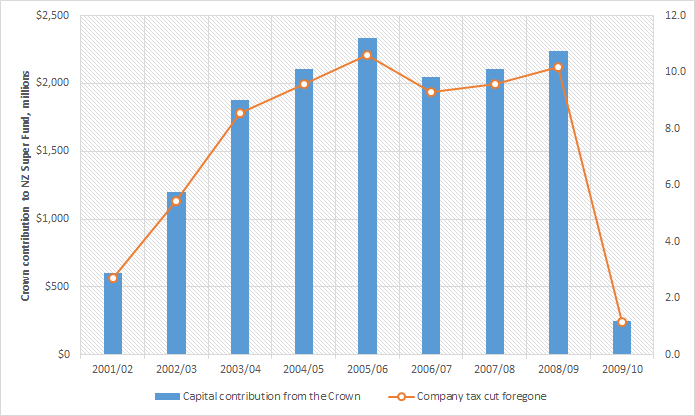
The New Zealand Government has contributed $14.88 billion to the fund from prior its inception in 2001 to the suspension of contributions in 2009 by the incoming National Party Government.
Source: New Zealand Treasury.
Over the nine years in which contributions were made, the company tax rate of 28% could have easily been up to 10 percentage points lower.
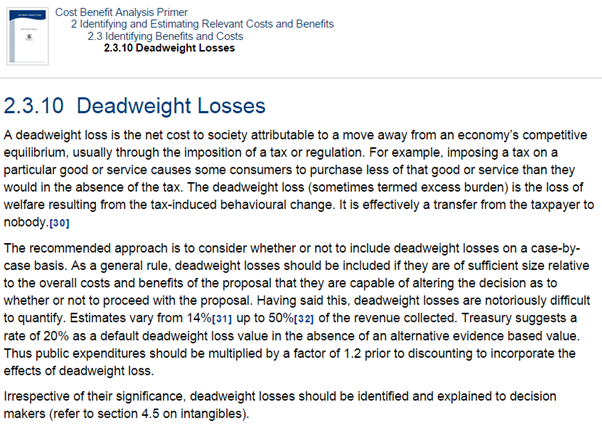
The New Zealand Treasury estimates that a one percentage point cut in the company tax costs about $220 million in forgone revenue if there are no other changes to the tax system. These are static estimates that do not include any feedback from greater investment and higher growth.
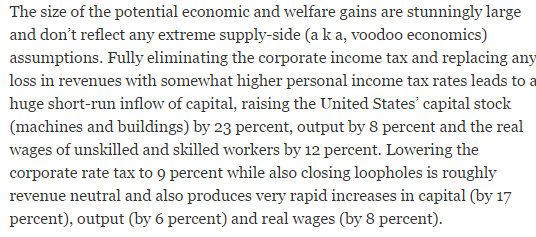
The New Zealand Superannuation Fund must beat the market every single year to make up for the deadweight cost of its funding, a premium for the investment risk added to the Crown’s portfolio and the cost to New Zealand’s growth rate of higher than otherwise taxes on income, entrepreneurship and investment.
Source: Abolish the Corporate Income Tax – The New York Times.
Incidence of long-term unemployment in the PIGS since 1983
17 Aug 2015 Leave a comment
in business cycles, currency unions, economic growth, economic history, Euro crisis, job search and matching, labour economics, labour supply, macroeconomics, occupational choice, unemployment, unions, welfare reform Tags: employment law, equilibrium unemployment, Greece, Italy, labour market regulation, natural unemployment rate, Portugal, Spain, unemployment duration
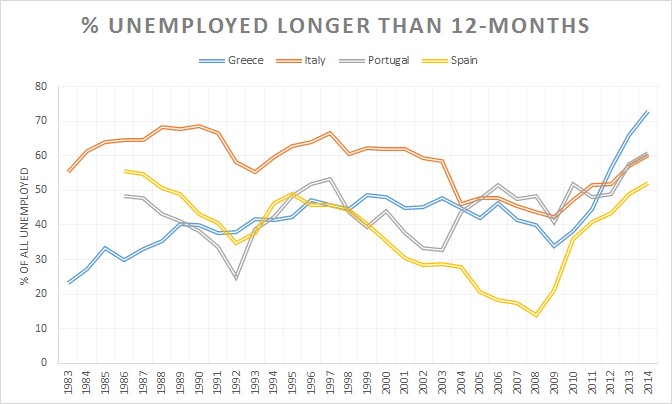
The boom that preceded the bust in the Greek economy did nothing for the rate of long-term unemployment among Greeks. Long-term unemployment had been pretty stable prior to the economic boom after joining the euro currency union.
Source: OECD StatExtract.
Nothing much happened to long-term unemployment in Italy or Portugal in recent decades. Spanish long-term unemployment fell in line with the economic boom in Spain over the 1980s and 1990s up until the global financial crisis.
UK has the lowest company tax rate in the G20
16 Aug 2015 Leave a comment
in applied price theory, economic growth, fiscal policy, macroeconomics, politics - Australia, politics - New Zealand, politics - USA, Public Choice, public economics Tags: British economy, company tax rate, company taxation, optimal tax theory, race to the top, tax competition
IFS Friday Figure: UK has the lowest corporate tax rate in the G20 #Budget2015 announced a 2% cut by 2020 #IFSFriFig http://t.co/T4Oq6ZXYd4—
IFS (@TheIFS) July 24, 2015
% of unemployment lasting longer than 12 months in Scandinavia since 1976
16 Aug 2015 Leave a comment
in applied welfare economics, business cycles, constitutional political economy, economic history, job search and matching, labour economics, labour supply, macroeconomics, Public Choice, unemployment Tags: borders, deployment subsidies, economics of borders, equilibrium unemployment rate, Finland, labour market programs, long-term unemployment, maps, natural unemployment rate, Norway, Scandinavia, search and matching, Sweden, unemployment durations
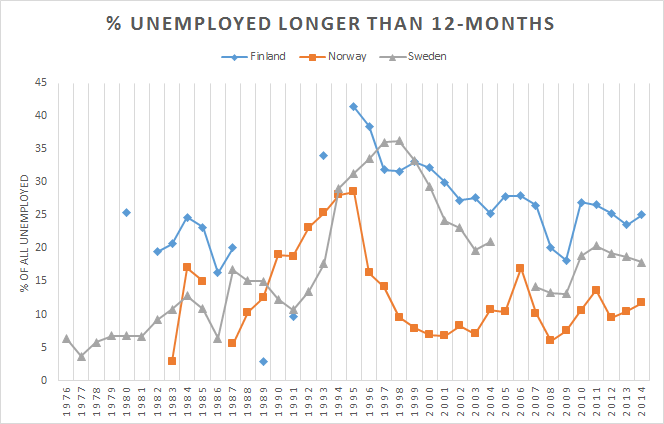
As I recall, most unemployed have been unemployed longer than 12 months in Sweden have to go on a labour market program. When they returned to unemployment after the program, the clock starts again. They are deemed to be freshly unemployed rather than adding to the previous spell with an interlude on a make work program. This makes Swedish long-term unemployment data rather unintelligible.
Source: OECD StatExtract.
Finland was recovering from its worst depression since the 1930s and the early 1990s when its data on long-term unemployment started to be continuous. This makes Finnish unemployment data rather difficult to interpret. Norway’s data for the long-term unemployed goes up and down a bit too much to be trustworthy without a background policy narrative.
% of unemployment that is more than 12 months, USA, UK, Germany and France
14 Aug 2015 Leave a comment
in currency unions, Euro crisis, job search and matching, labour economics, labour supply, macroeconomics, unemployment Tags: British economy, equilibrium unemployment rate, France, Germany, long-term unemployment, natural unemployment rate, social insurance, unemployment duration, unemployment insurance, welfare state
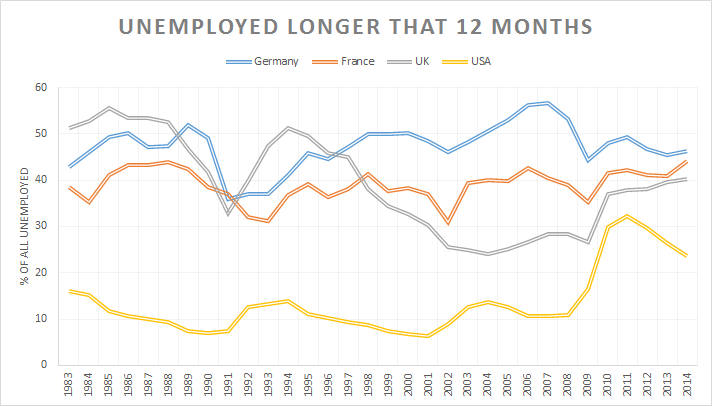
As the British labour market and long-term unemployment was starting to get something like that in the USA, the USA started to have unemployment it was more like the European labour markets in terms of the number of long-term unemployed. Nothing much happened in Germany and France.
Source: OECD StatExtract.


Recent Comments